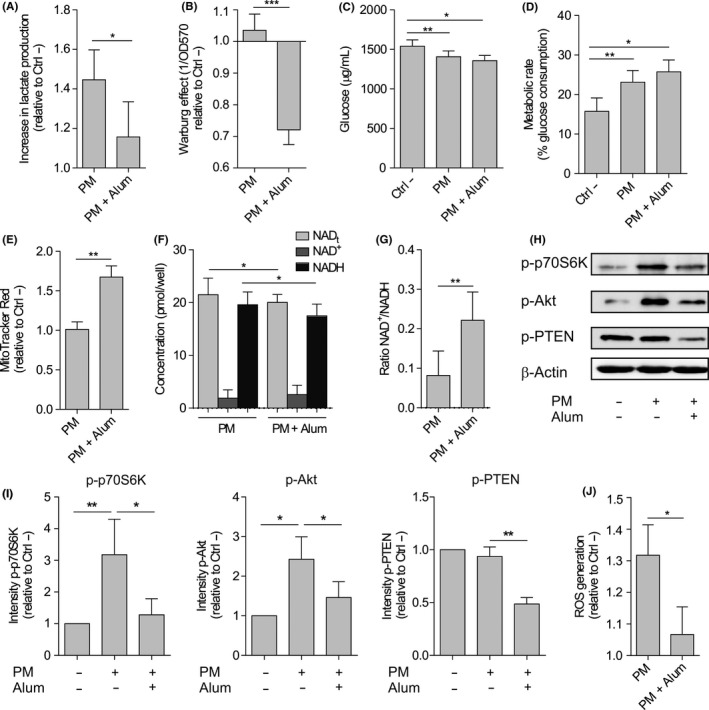
Figure 5.

Alum alters the metabolic reprogramming induced by PM in human DCs from healthy donors. A, Lactate content in cell‐free supernatants from PM‐ or PM and alum‐stimulated hmoDCs after 18 h relative to the unstimulated (Ctrl ‐) condition (n = 6). B, Quantification of the induced Warburg effect relative to the unstimulated (Ctrl ‐) condition (n = 6). C, Glucose consumption by stimulated DCs and (D) calculated metabolic rate (n = 6). E, Fluorescence intensity of stimulated hmoDCs stained with MitoTracker Red (n = 5). F, Cellular redox status analysed based on the determination of NAD+, NADH and total NAD levels (NADt) (n = 5). G, NAD+/NADH ratios. H, Western blot analysis of protein extracts from hmoDCs stimulated for 30 min in the indicated conditions, and one representative example out of 4 is shown. I, Quantification of the reactive phosphorylated bands by scanning densitometry (mean ± SEM of n = 4 independent experiments). J, Intracellular ROS quantification in hmoDCs after 18 h of stimulation with PM or PM and alum (n = 6). Paired Student t test: *P < .05, **P < .01 and ***P < .001
