
Figure 3.
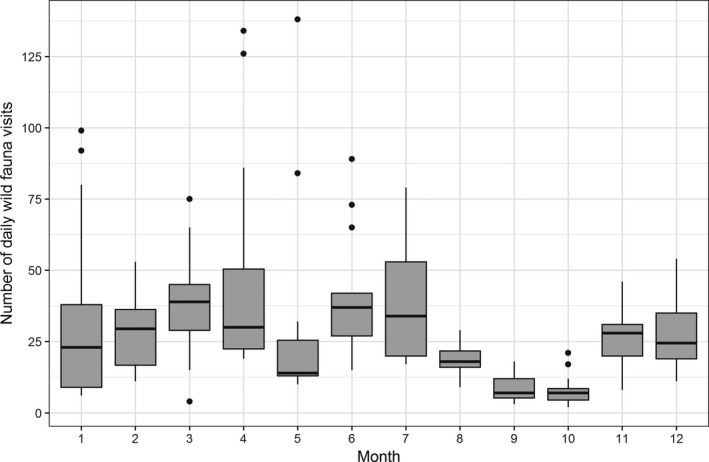
Distribution of the total daily wild fauna visits (unit of measurement: total daily wild fauna visits) to the free‐range area of the layer farm by month (fat dark line in the box: median; lower end of the box: 25% quantile; higher end of the box: 75% quantile; highest bullet or high end of the vertical line coming out of the box: highest value; lowest bullet or low end of vertical line coming out of the box: lowest value). A wild fauna visit was defined as one or more of wild birds from the same species landing, or wild animals (e.g. rat, mouse) entering, and subsequent staying for a continuous time period in the free‐range area (or sitting on the fence) until departing