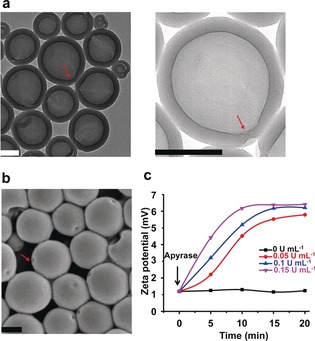
Figure 1.

a) TEM and b) SEM images of PLL‐modified stomatocytes. The red arrows indicate the opening of the stomatocytes. Scale bars=200 nm. c) Zeta potential changes of the ATP‐complexed PLL‐stomatocytes as a function of time upon the addition of apyrase. The PLL‐stomatocytes were pretreated with ATP (62.5 μm, r=1). Experimental conditions: 0.5 mg mL−1 PLL‐stomatocytes, MES buffer (5 mm, pH 6.5).
