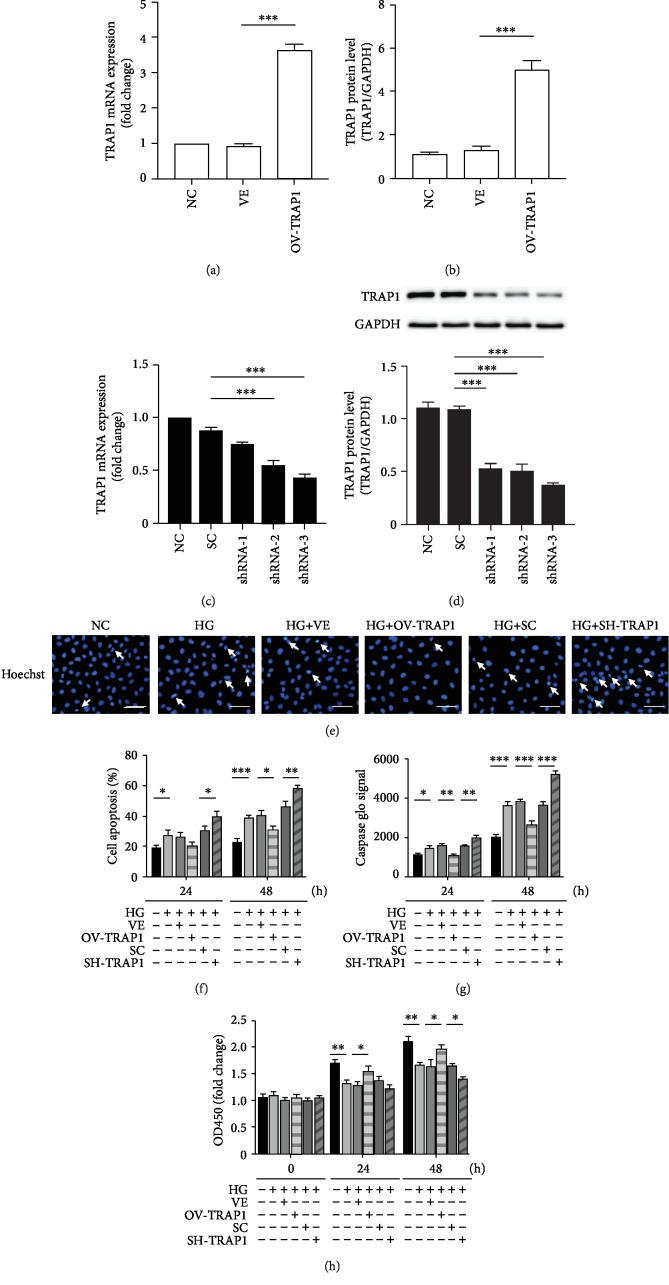
Figure 2.
Effects of TRAP1 on apoptosis and cell viability following exposure of NRK-52e cells to HG. (a, b) Relative TRAP1 mRNA levels and protein levels were determined by RT-PCR and western blot following transfection with the OV-TRAP1 lentiviral vector. (c, d) TRAP1 mRNA levels and protein levels were determined following transfection with lentiviral vectors expressing shRNA-1, shRNA-2, and shRNA-3. (e) Cells were stained with Hoechst 33258 (blue), and arrows indicate apoptotic cells. (f) The apoptosis rates were detected by flow cytometry after APC/7AAD dual staining. (g) Graph depicting the fold increase in apoptosis was assessed by caspase Glo assay. (h) Cell viability was determined with a CCK-8 assay. The results are presented as the mean ± SEM; n = 3, ∗p < 0.05, ∗∗p < 0.01, ∗∗∗p < 0.001. VE: vector group; SC: scramble group.

