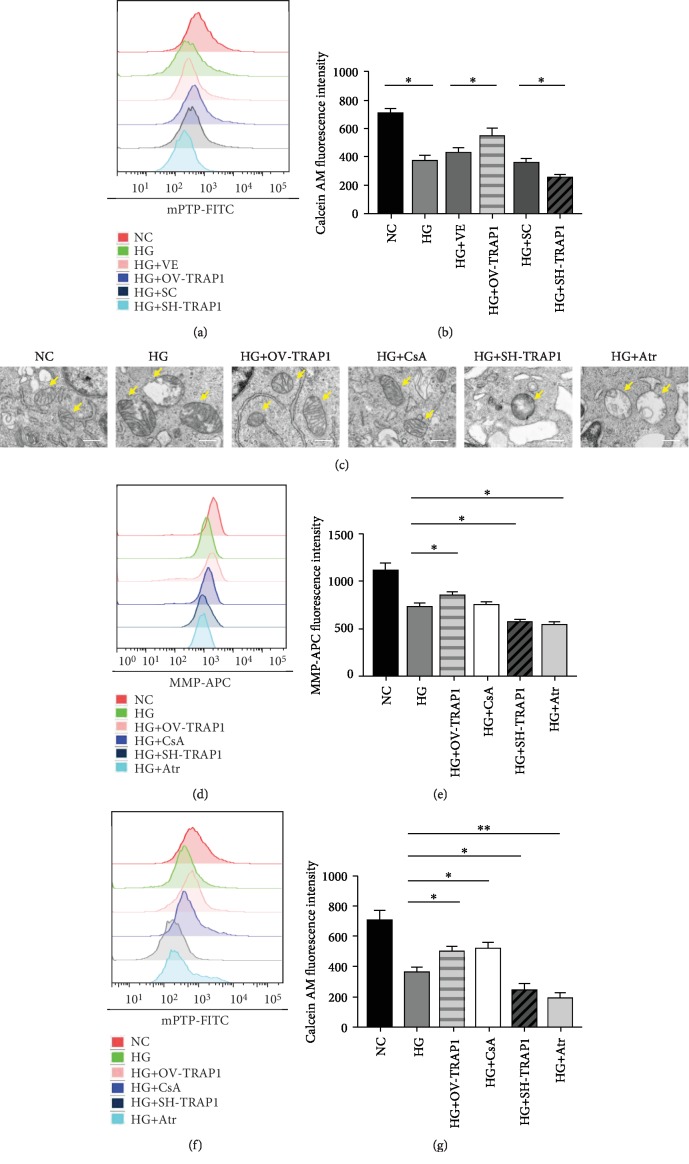
Figure 4.
TRAP1 protects against high-glucose-induced mitochondrial dysfunction via mPTP opening regulation. (a, b) Representative graphs and statistical analyses of mPTP by flow cytometry with the fluorescent probe calcein AM labeling. (c) Mitochondrial ultrastructural damage was observed by TEM. Arrows indicate mitochondria; scale bar, 500 nm. (d, e) Typical graphs of mitochondrial membrane potential and statistical analysis determined with tetramethylrhodamine ethyl ester labeling by flow cytometric analysis at 48 h. (f, g) Representative graphs and statistical analysis of mPTP by flow cytometry. mPTP: mitochondrial permeability transition pore. The results are presented as the mean ± SEM; n = 3, ∗p < 0.05, and ∗∗p < 0.01 for each pair of groups indicated.

