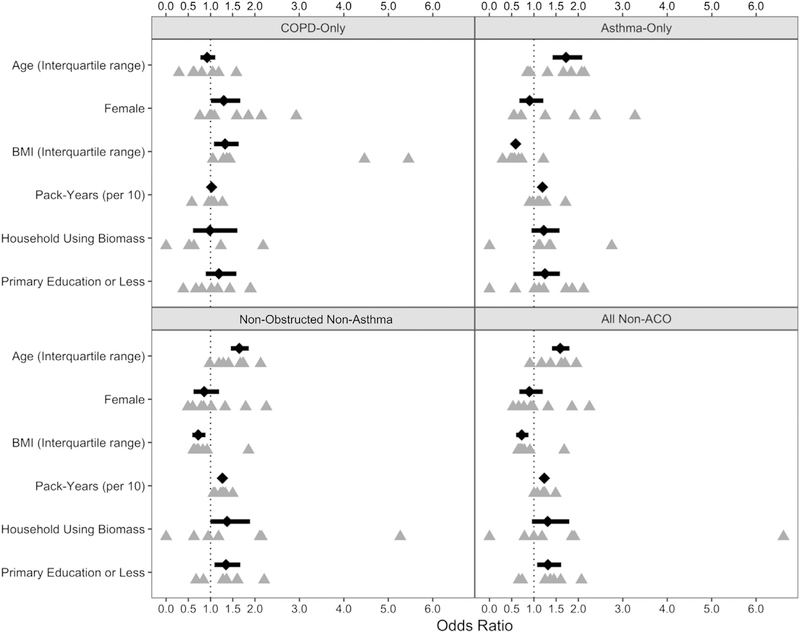
FIG 2.
Forest plot of risk factors for ACO. Risk factors are presented as ORs for presence of ACO compared with reference populations represented by each panel (ACO vs COPD-Only, ACO vs Asthma-Only, ACO vs Nonobstructed nonasthma, and ACO vs all without ACO). ORs are represented by black diamonds while the 95% CI is represented by horizontal bars. Site-specific estimates are represented by gray triangles directly under the overall estimate. Overall estimates were generated via alternating logistic regressions, which accounted for clustering by site. All models included each risk factor presented here.

