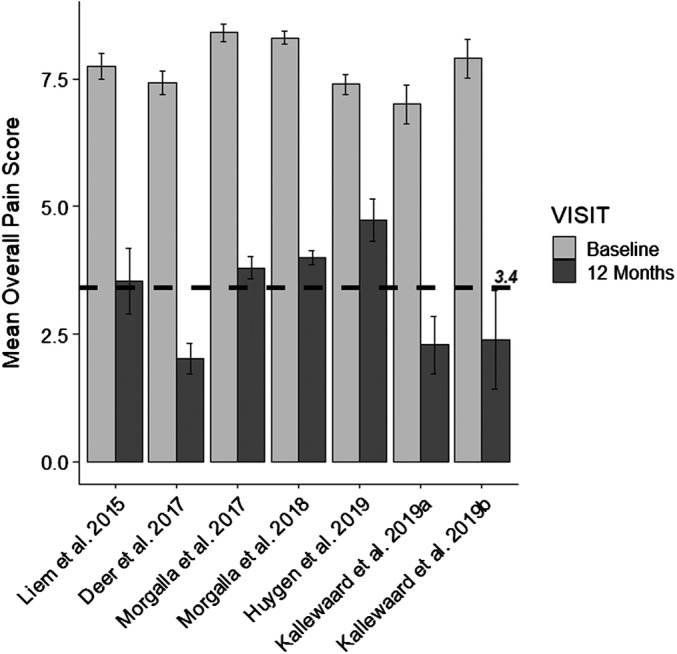
Figure 2.

The mean score for each study is shown at baseline and at 12‐month follow‐up with the standard error of the mean. The mean weighted score across all studies at 12 months (3.4) is shown by a dashed line.

The mean score for each study is shown at baseline and at 12‐month follow‐up with the standard error of the mean. The mean weighted score across all studies at 12 months (3.4) is shown by a dashed line.