
Figure 3.
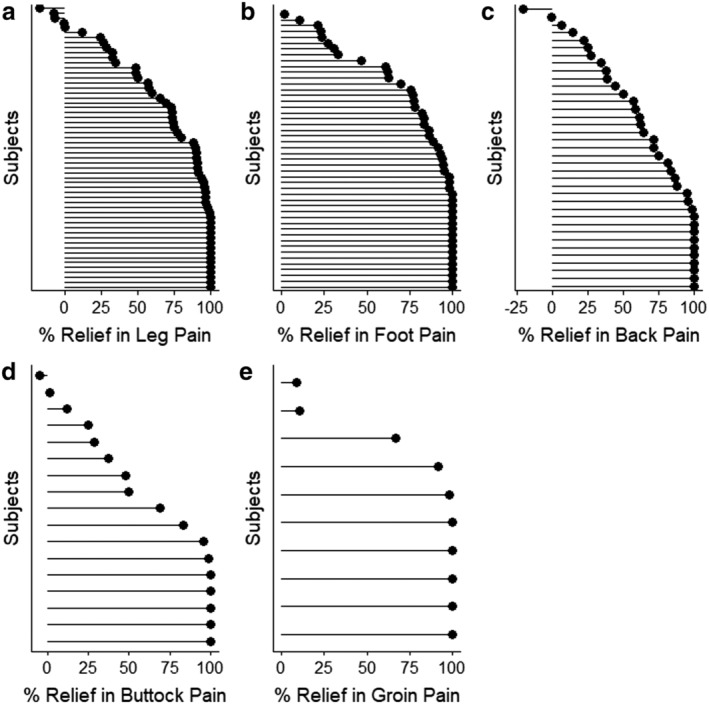
The top five pain locations are shown (A–E) in order of the number of subjects. The line informs the change from baseline and the circle is lined up at the percent relief calculated. Subjects are ordered in increasing order within each panel.