Figure 4.
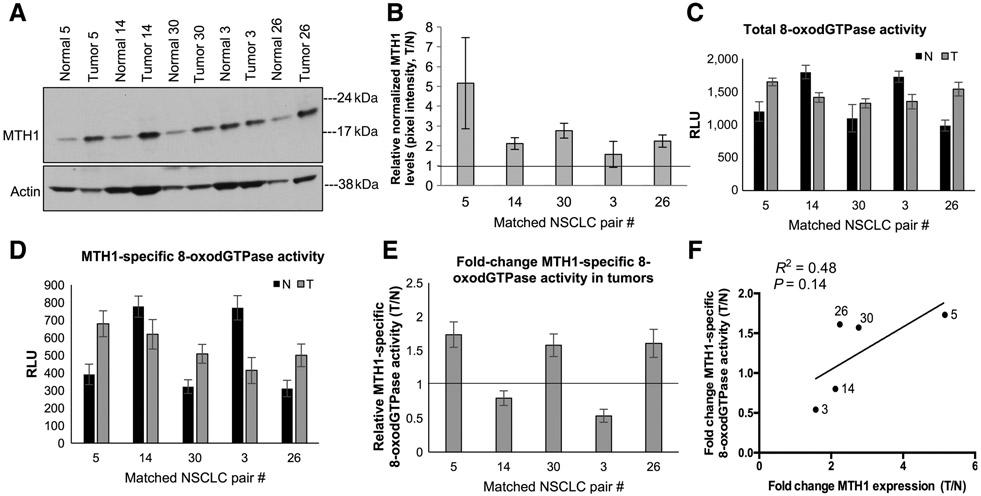
Comparison of MTH1-specific 8-oxodGTPase activity in non–small cell lung cancer (NSCLC) human specimen with their respective MTH1 protein expression levels. A, Immunoblot showing MTH1 protein levels in matched human normal lung/lung cancer specimens derived from untreated stage I/stage II patients with NSCLC. Actin is shown as the loading control. B, Fold changes in tumor (T) versus normal (N) MTH1 protein expression. Pixel density from the immunoblot MTH1 signals from A and Supplementary Fig.2A, normalized to the loading control, were quantified via ImageJ. The horizontal line represents the normal tissue baseline set at 1 for each pair. Error bars, ±SEM. C, Total 8-oxodGTPase activity in each matched pair of NSCLC tumors. Results are derived from two independent experiments (n = 2) with each sample run in triplicate. D, Corresponding MTH1-specific 8-oxodGTPase activity, calculated by subtracting the luminescent ARGO signal from TH287-treated counterpart lysates. Results are derived from two independent experiments (n = 2) with each sample run in triplicate. Error bars, ± SD. E, Relative MTH1-specific 8-oxodGTPase activity changes in the tumor versus adjacent normal tissues is shown as a fold change between tumor (T)/normal (N) values from D. The horizontal line represents the normal tissue baseline set at 1 for each pair. Error bars, ± SD. F, Linear regression analysis comparing fold change (T/N) MTH1 protein expression against fold change (T/N) MTH1-specific 8-oxodGTPase activity in the matched normal versus tumor patient tissue. Robustness of fit and P values, calculated in GraphPad Prism, are shown.

