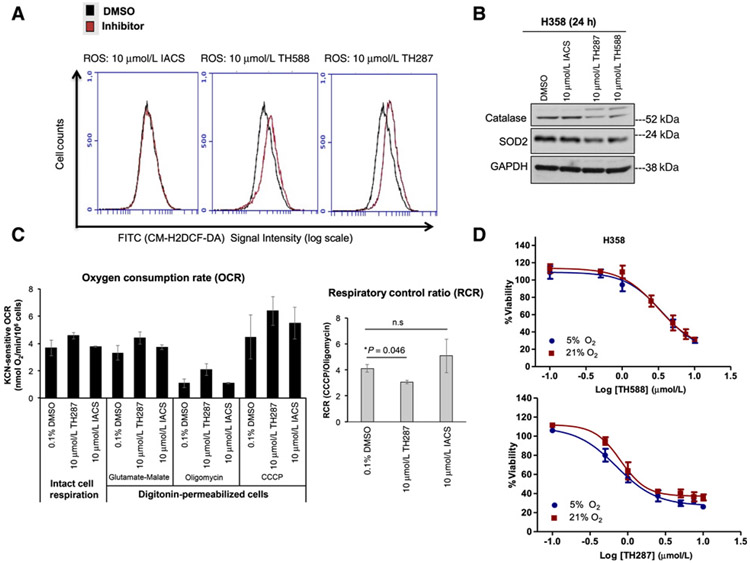
Figure 6.
The first-in-class MTH1 inhibitors produce ROS and decrease OXPHOS efficiency relative to the noncytotoxic MTH1 inhibitor, IACS-4759. A, ROS levels in untreated and MTH1 inhibitor–treated cells. H358 cells were plated at an equivalent density and treated with either DMSO or the indicated inhibitors for 17 hours. All samples were harvested via trypsinization and, following incubation with CM-H2DCF-DA, concurrently assessed for total ROS levels via signal detection in the FITC channel. The flow cytometric profiles shown are representative of two independent runs. B, Immunoblotting for antioxidant proteins in H358 cells treated with DMSO or 10 μmol/L MTH1 inhibitors for 24 hours. Approximately 10 μg of total protein lysates were immunoblotted and probed with the indicated antibodies. GAPDH is shown as a loading control. This blot is representative of two independently run blots. C, The first-in-class MTH1 inhibitor, TH287, shows indications of decreased OXPHOS efficiency. H358 cells were treated for 22 hours with the indicated MTH1 inhibitors (10 μmol/L) or vehicle (0.1% DMSO). To assess mitochondrial respiratory capacity, the treated cells were subjected to polarographic measurements of intact cell respiration. Subsequently, the cells were permeabilized with digitonin, followed by the subsequent injection of the indicated substrates, prior to measurement of respiration. Oxygen consumption rates (OCR) were calculated as specified in the Materials and Methods section (left). The respiratory control ratio (RCR, right) was calculated by dividing the KCN-sensitive CCCP OCR by the KCN-sensitive oligomycin OCR. Error bars, ± SD. D, Cells cultured at 5% oxygen tension are not protected from the cytotoxic effects of TH588 or TH287. H358 cells were cultured at 5% or 21% oxygen for 12 days prior to plating for the indicated drug treatments in triplicate. Cells were kept at their respective oxygen conditions during the 72-hour treatment period. Viability was assessed via the CellTiter-Glo assay and drug responses curves established as in Fig. 5. Error bars, ± SD.

