Figure 7.
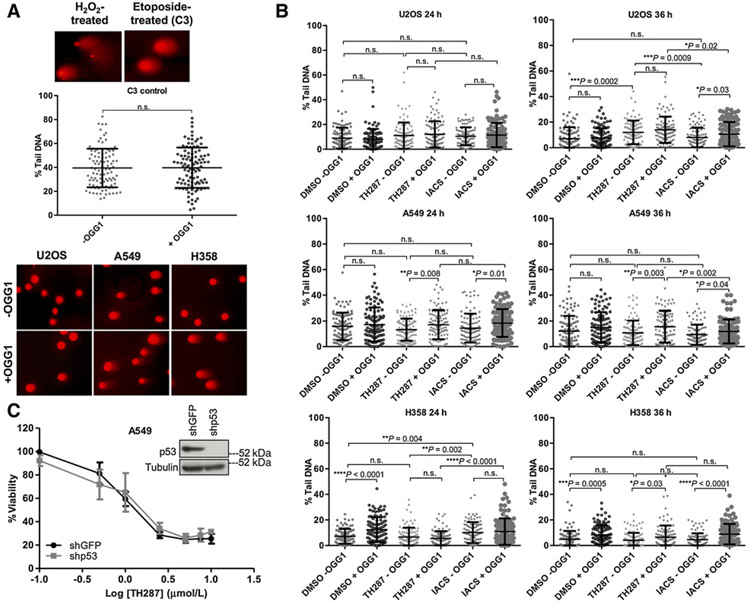
The cytotoxic effects of the first-in-class inhibitors do not arise from an enhanced ability to introduce genomic 8-oxodG incorporation relative to IACS-4759. A, Top, representative images of H2O2− or etoposide-treated positive controls from the comet assay. Middle, scatter plots showing quantification of % tail DNA between untreated (−OGG1) and treated (+OGG1) C3 cells (n= 2). Each point on the graph is the %tail DNA quantified from a single cell, and 100 cells in total were quantified for each condition, over two independent samples (n.s., nonsignificant). Error bars, ± SD. Bottom, representative examples of comets from −OGG1 and +OGG1 U2OS, A549, and H358 cells (DMSO vehicle-treated), showing the spectrum of % tail DNA scored in Fig. 7B. Images are shown at a 10× magnification. B, Quantitation of % tail DNA. One-hundred individual determinations from U2OS, A549, and H358 cells treated for 24 or 36 hours with DMSO, 10 μm/L TH287 or 10 mm/L IACS, either with or without OGG1 treatment (n = 2) are shown. Each point on the graph is the % tail DNA of a single cell, and 100 cells were quantified per each condition. The P values were calculated by an unpaired Student t test with Welch correction applied if variances were found to be unequal, and are indicated above the relevant comparison groups (n.s., nonsignificant). Error bars, ± SD. C, TH287 treatment–induced loss of viability in the p53 wild type A549 cells is not rescued by p53 knockdown. Cells were transduced with shGFP or shp53, selected in puromycin-containing media, and then plated in triplicate for TH287 treatment over 72 hours. Viability was assessed via the CellTiter-Glo assay and drug responses curves established. Error bars, ± SD. The extent of p53 knockdown is shown via immunoblot (inset).

