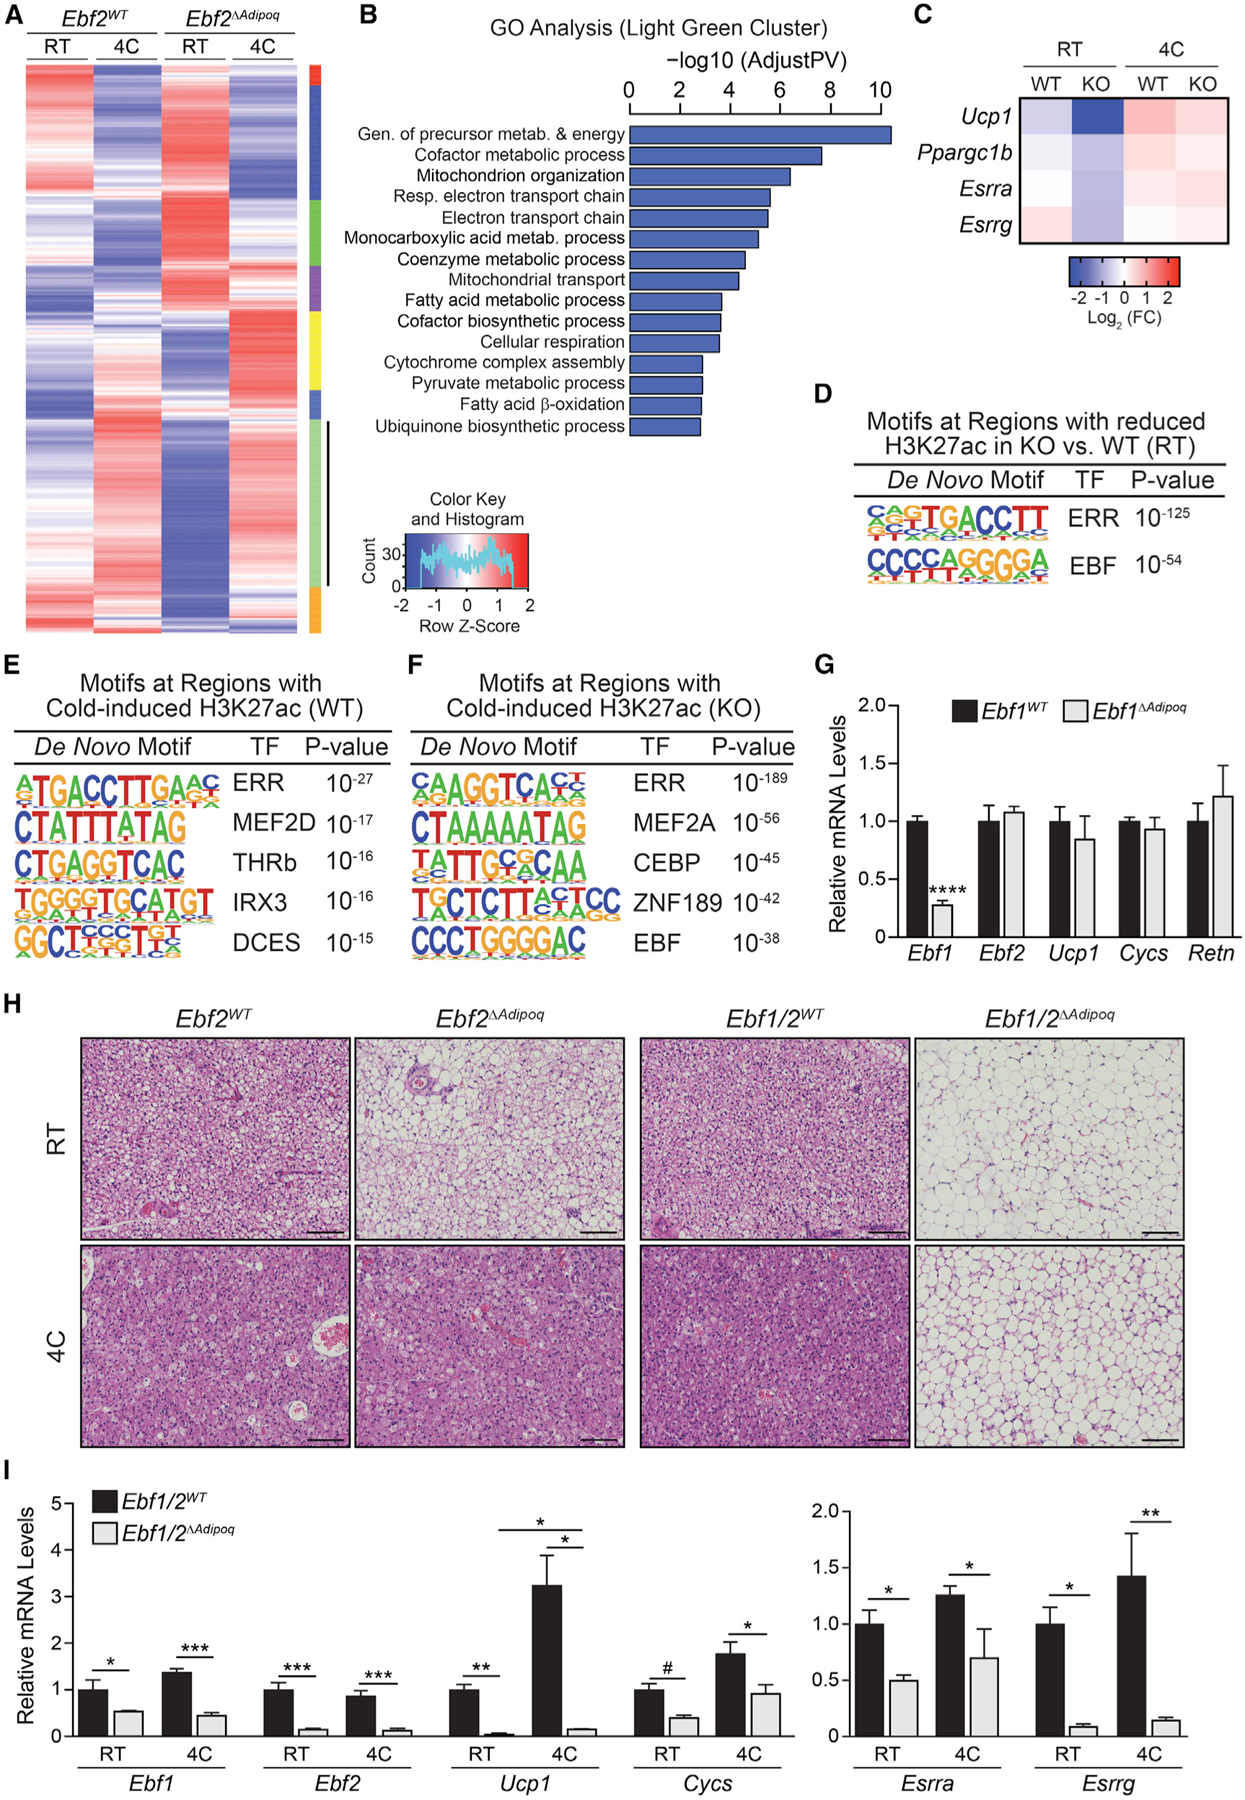
Figure 3. EBF Activity Controls Basal and Adaptive Thermogenic Gene Expression.

(A) Clustering analysis of gene expression in BAT from Ebf2WT and Ebf2ΔAdipoq mice housed at RT or 4°C for 1 week (n = 3 mice per group).
(B) Gene Ontology analysis of genes in the light green cluster.
(C) Heatmaps of selected genes from light green cluster in (A). Mean log2 fold change (FC).
(D) De novo motif analysis of regions with decreased H3K27ac levels in Ebf2 mutant versus control (WT) BAT of mice housed at RT.
(E and F) De novo motif analysis of regions that display increased H3K27ac levels during cold exposure in BAT from (E) Ebf2WT and (F) Ebf2ΔAdipoq mice.
(G) Relative mRNA levels of Ebf1, Ebf2, and other indicated genes in BAT from Ebf1WT and Ebf1ΔAdipoq mice housed at RT (n = 4 mice per group; mean ± SEM).
(H) Hematoxylin and eosin staining of BAT from Ebf2WT, Ebf2ΔAdipoq, Ebf1/2WT, and Ebf1/2ΔAdipoq mice housed at RT or 4°C for 1 week (scale bar, 100 μm).
(I) Relative mRNA levels of indicated genes in BAT from Ebf1/2WT (control) and Ebf1/2ΔAdipoq (double knockout [DKO]) mice housed at RT or 4°C for 1 week (n = 3–4 mice per group; mean ± SEM).
