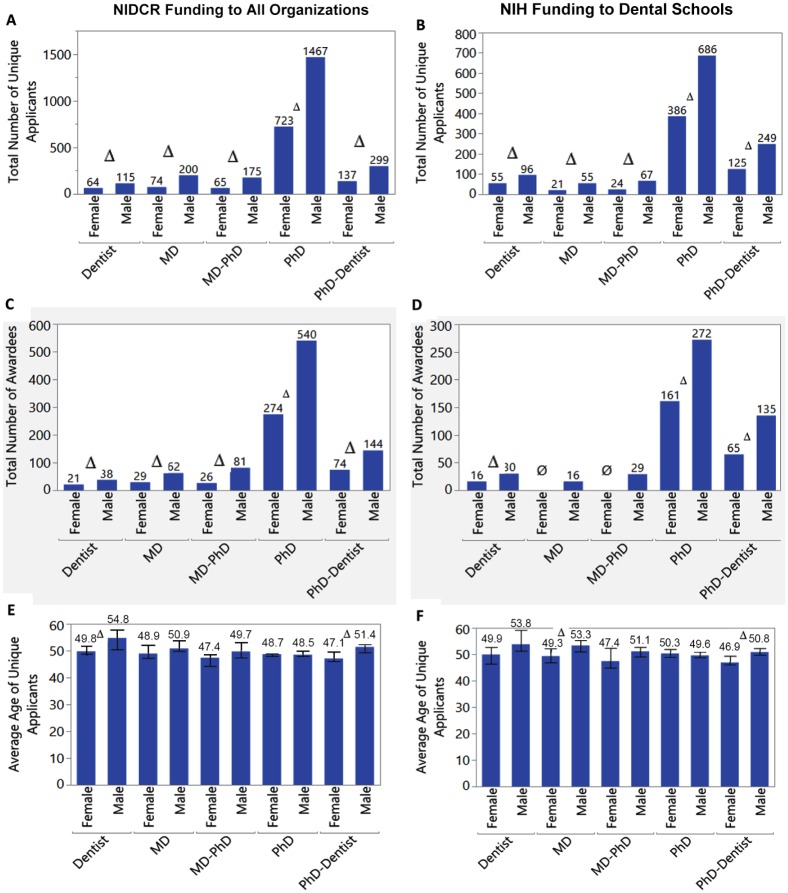
Figure 2.
Total number of unique applicants, total number of unique awardees, and average age of unique applicants: (A, C, E) NIDCR and (B, D, F) NIH. The bar charts on the left represent all applicants or awardees to any organization funded by the NIDCR, while the bar charts on the right represent all applicants or awardees to dental schools funded by the NIH. The x-axis is the combination of gender and degree. (A–D) Total values. (E, F) Median values with error bars indicating mean minimum and maximum data for fiscal years 2007 to 2016. ∆, P < 0.01. Ø, sample size <10. NIDCR, National Institute of Dental and Craniofacial Research; NIH, National Institutes of Health.

