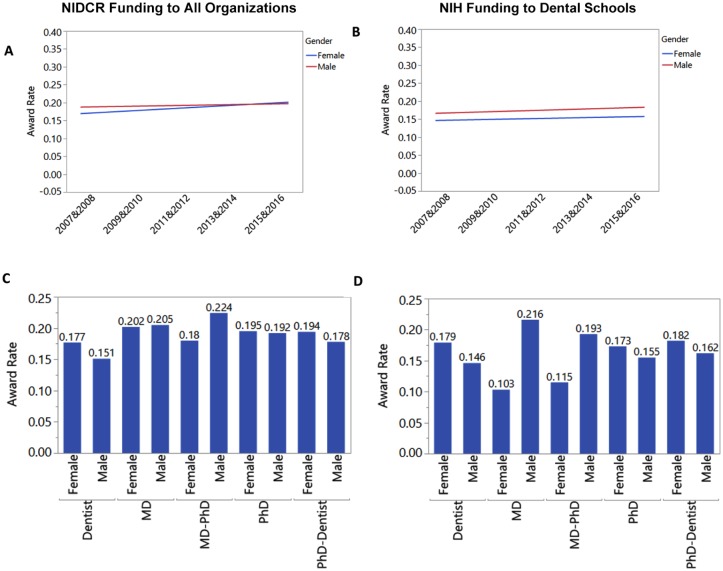
Figure 3.
RPG award rates by gender, fiscal year interval (2007 to 2016,) and degree (PhD, MD-PhD, PhD-dentist, dentist, MD, or other). Results of analysis of covariance assessments are illustrated for (A) NIDCR data and (B) NIH data. The red and blue lines represent linear fits for male and female researchers, and data points (not shown) are for the degrees. Differences in award rates between genders and degrees are illustrated with bar charts: (C) NIDCR and (D) NIH. The x-axis for the bar charts indicates the gender and degree. The bars are total values for all fiscal years (2007 to 2016). The plots and bar charts on the left (A, C) represent all applications or awards to any organization funded by the NIDCR, while those on the right (B, D) represent all applications or awards to dental schools funded by the NIH. For all analyses represented in Figure 3, no significant difference was determined between genders (P ≥ 0.08). NIDCR, National Institute of Dental and Craniofacial Research; NIH, National Institutes of Health; RPG, Research Project Grant.

