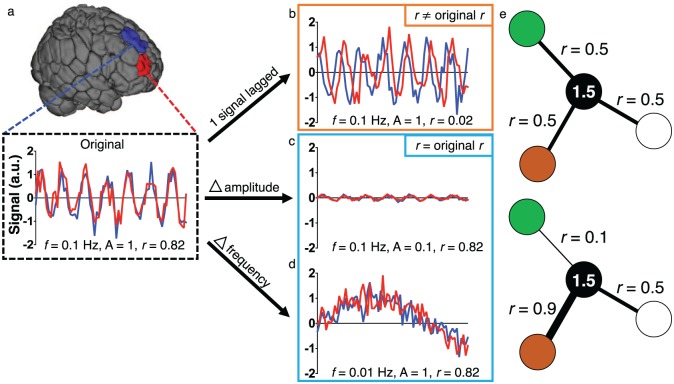
Figure 7.
Using region- or connection-based approaches in isolation potentially obscures changes due to a lesion. (a) Consider the two colored regions for which the BOLD signal is measured over time. The original signals have similar characteristics (amplitude of 1, frequency of 0.1 Hz) and are synchronized, resulting in a Pearson correlation coefficient of 0.82. (b) A disturbance results in one signal exhibiting a delay. Because the signals are now lagged, they have a correlation of approximately 0, despite having the same amplitudes and frequencies as before the disturbance—regional measures, like the amplitude of low frequency fluctuations (ALFF) or fractional ALFF (f/ALFF) would be unaffected in this example. In (c) and (d), disturbances affect the amplitude (c) or frequency (d) of the signals. Because the two signals are still synchronized in both cases, the correlation remains high, but differences in the signal are clearly observed. In (e), the black node has the same overall weighted degree in the top and bottom panels, despite differences in connectivity between specific region pairs. a.u. = arbitrary units; f = frequency; A = amplitude; r = Pearson correlation coefficient.

