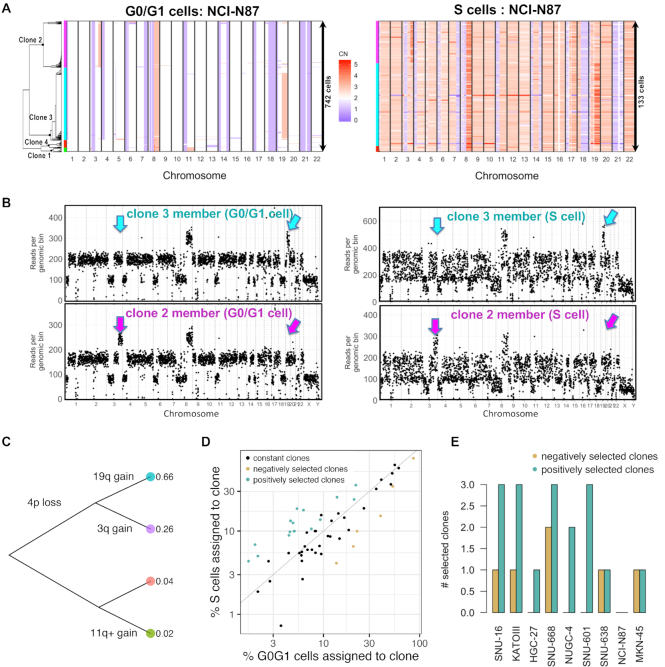
Figure 2.
Single cell DNA-seq characterizes clonal composition and evolution in gastric cancer cell lines. (A) Copy number landscape of G0/G1 cells (left) is shown alongside S cells (right) for each clone detected in NCI-N87 (left color bars). (B) Copy number segmentation profile shown for an G0/G1- and an S representative of the two largest clones in (A) (cyan and purple). Arrows indicate genomic regions where the two clones diverge. (C) Genetic events leading to the divergence of the four co-existing clones in NCI-N87. (D) The percentage of replicating cells per clone increased with percentage of G0/G1 cells per clone in NCI-N87 as well as in the other eight cell lines, indicating predominant clonal stasis (Pearson r = 0.88; P < 2e-16). Selection of clones (color-coded) was calculated as probability of sampling the % replicating cells observed for a given clone, conditional on the G0/G1 representation of that same clone using the hypergeometric distribution. Clones were assigned to three groups: positive selection (n = 17), no selection (n = 34) and negative selection (n = 6). (E) Number of selected clones per cell line. [CN: copy number].

