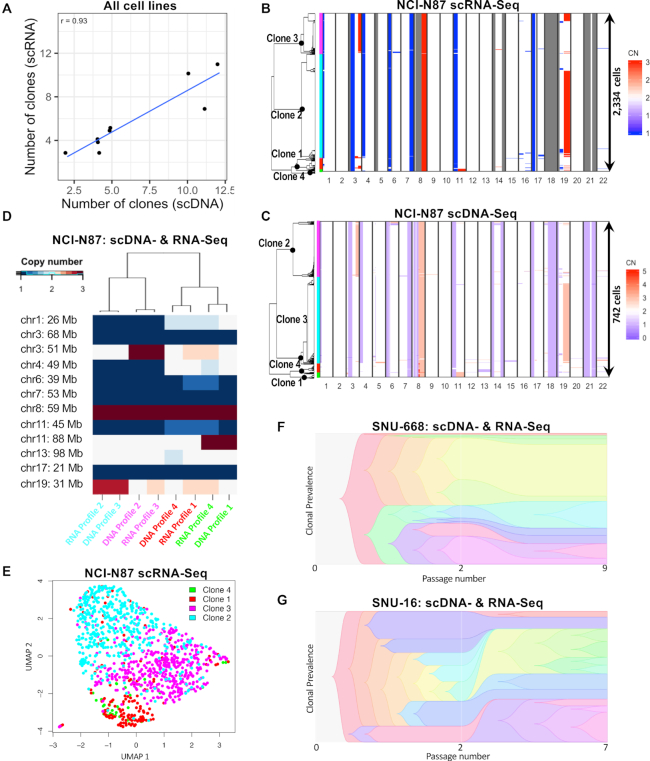
Figure 3.
Consilience of scDNA- and scRNA-seq on G0/G1 clonal architectures. (A) Correlation between number of clones inferred by scRNA- and scDNA-seq across all nine cell lines. (B–E) Integrated analysis of cell line NCI-N87. ScRNA-seq derived copy number landscape of 2334 G0/G1 cells detected in NCI-N87 (B), independently distinguishes the same four clones as scDNA-seq of 742 G0/G1 cells (C). Clone membership is color coded on the left. (D) Each CNV profile found by scRNA-seq had an equivalent CNV profile in the scDNA-seq data, applying to a similar % of cells. (E) A UMAP map of NCI-N87 cells shown in panel C based solely on their expression signatures. Clones defined by copy number alterations, are enriched in specific areas of the transcriptionally defined UMAP. (F and G) Differences in passage number between scDNA- and scRNA-seq experiments for SNU-668 (F) and SNU-16 (G) accompany differences in clonal composition (39) observed between the two techniques. [CN: copy number].

