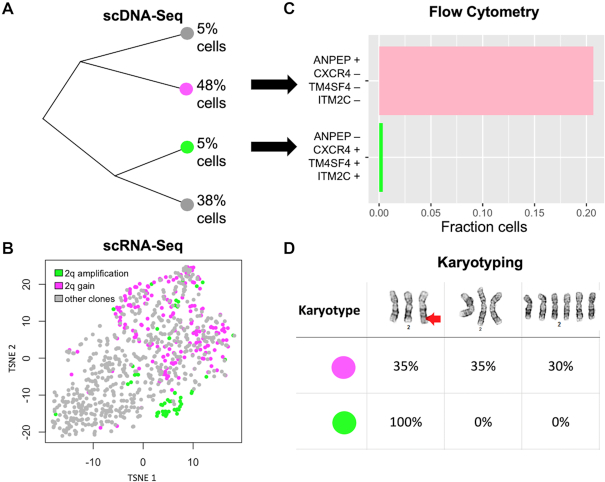
Figure 4.
Integrated single cell sequencing informs live-cell-sorting of NUGC-4 clones. (A) Phylogenetic tree of the four clones detected by scDNA-seq in NUGC-4. (B) G0/G1 cells are shown in tSNE space—every dot is a cell, and two clones of interest are highlighted in purple and green. The purple clone has three copies of a large genomic region on chromosome 2q (2q gain), whereas the green clone has an extra copy of that same segment (2q amplification). Cells are colored based on their CNVs, whereas their location in tSNE space is based on their expression signature. (C) The top four cell surface markers informing separation of the green and purple clone in tSNE space were: ANPEP, CXCR4, TM4SF4 and ITM2C. We used flow cytometry with these four markers to enrich for the respective clone. (D) Cytogenetic analysis of chromosome 2 identified three karyotypes among the two isolated subpopulations (top row), including a rearrangement on the q-arm (red arrow). All of the cells (100%) from the green subpopulation had a chromosome 2q rearrangement, whereas the purple subpopulation contained only 35% cells with the rearrangement.

