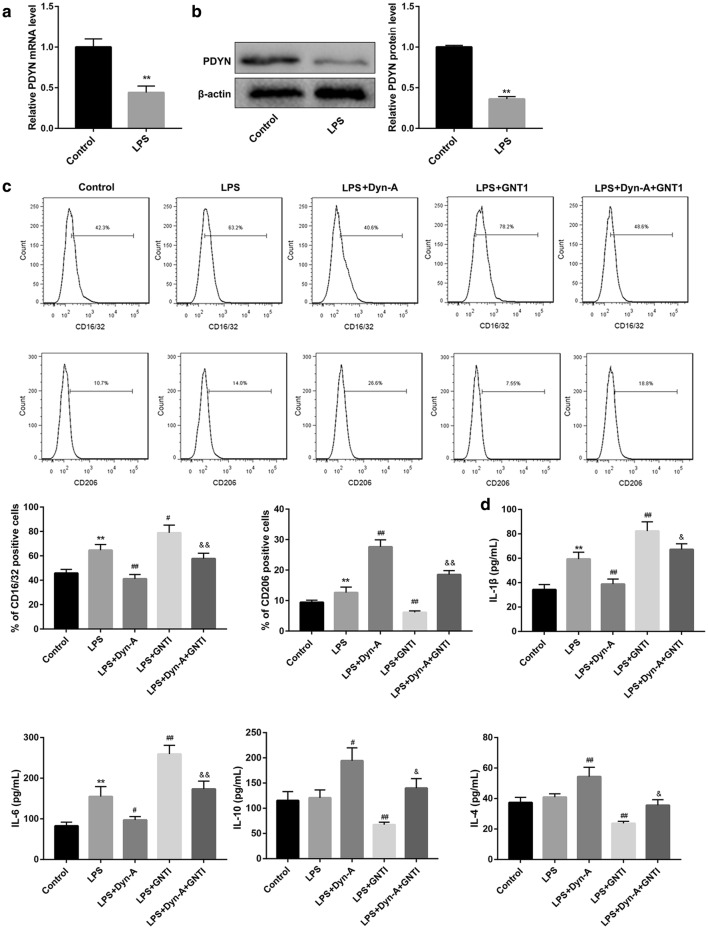
Fig. 4.
Dynorphin activation of KOR promoted microglial M2 polarization in LPS-stimulated BV-2 microglial cells. a qRT-PCR analysis of PDYN mRNA expression and b western blot analysis of PDYN protein level in BV-2 microglial cells stimulated without or with LPS (1 µg/mL, 24 h). c Determination of CD16/32 and CD206 expression by flow cytometry and d levels of M1-related cytokines (IL-1β and IL-6) and M2-related cytokines (IL-4 and IL-10) by ELISA in BV-2 cells in the groups of Control, LPS, LPS + Dyn-A, LPS + GNT1, and LPS + Dyn-A + GNT1. N = 3. Dyn-A, Dynorphin-A. **p < 0.01, vs. Control group, #p < 0.05, ##p < 0.01, vs. LPS group; &p < 0.05, &&p < 0.01, vs. LPS + Dyn-A group

