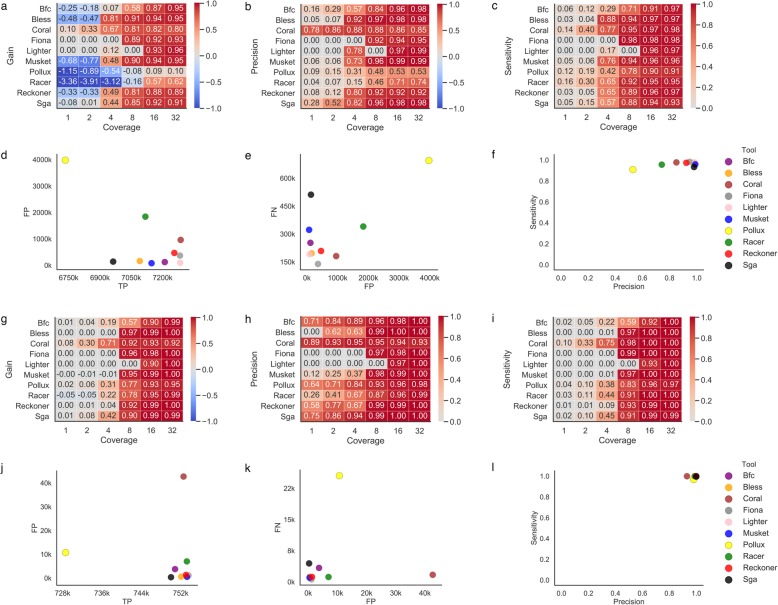
Fig. 2.
Correcting errors in whole genome sequencing data (D1 dataset). For each tool, the best k-mer size was selected. a–f WGS human data. g–l WGS E. coli data. a, g Heatmap depicting the gain across various coverage settings. Each row corresponds to an error correction tool, and each column corresponds to a dataset with a given coverage. b, h Heatmap depicting the precision across various coverage settings. Each row corresponds to an error correction tool, and each column corresponds to a dataset with a given coverage. c, i Heatmap depicting the sensitivity across various coverage settings. Each row corresponds to an error correction tool, and each column corresponds to a dataset with a given coverage. d, j Scatter plot depicting the number of TP corrections (x-axis) and FP corrections (y-axis) for datasets with 32x coverage. e, k Scatter plot depicting the number of FP corrections (x-axis) and FN corrections (y-axis) for datasets with 32x coverage. f, l Scatter plot depicting the sensitivity (x-axis) and precision (y-axis) for datasets with 32x coverage

