
Fig. 5.
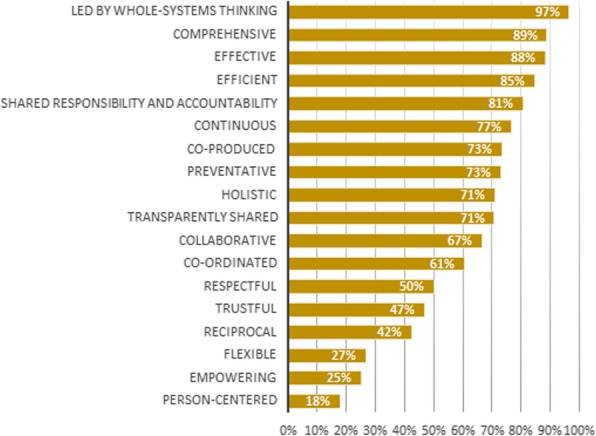
Average relevance scores of each value on the system level Graph showing, for each value, the percentage of Delphi panel members that assessed the value as relevant on the personal level
Official websites use .gov
A
.gov website belongs to an official
government organization in the United States.
Secure .gov websites use HTTPS
A lock (
) or https:// means you've safely
connected to the .gov website. Share sensitive
information only on official, secure websites.
Average relevance scores of each value on the system level Graph showing, for each value, the percentage of Delphi panel members that assessed the value as relevant on the personal level