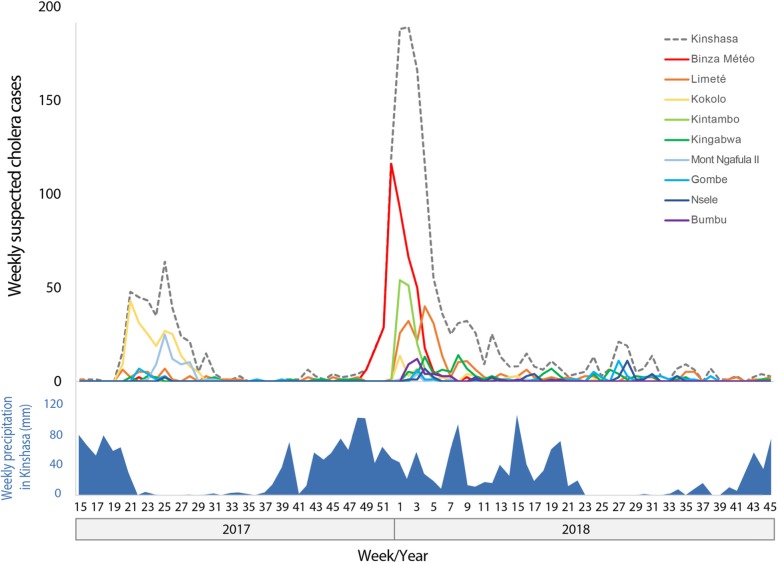
Fig. 3.
Epidemic curves of the cholera outbreak in Kinshasa and corresponding weekly precipitation levels. The epidemic curve and weekly precipitation levels cover week 15 of 2017 to week 45 of 2018. The top panel displays weekly cholera case numbers in the entire city (dashed line) as well as heavily-affected health zones, which are color-coded and ordered based on cumulative number of cholera cases during the 2017–2018 period (up to week 45, 2018) as displayed in Additional file 1. The bottom panel displays the corresponding estimated weekly precipitation levels in Kinshasa (mm)

