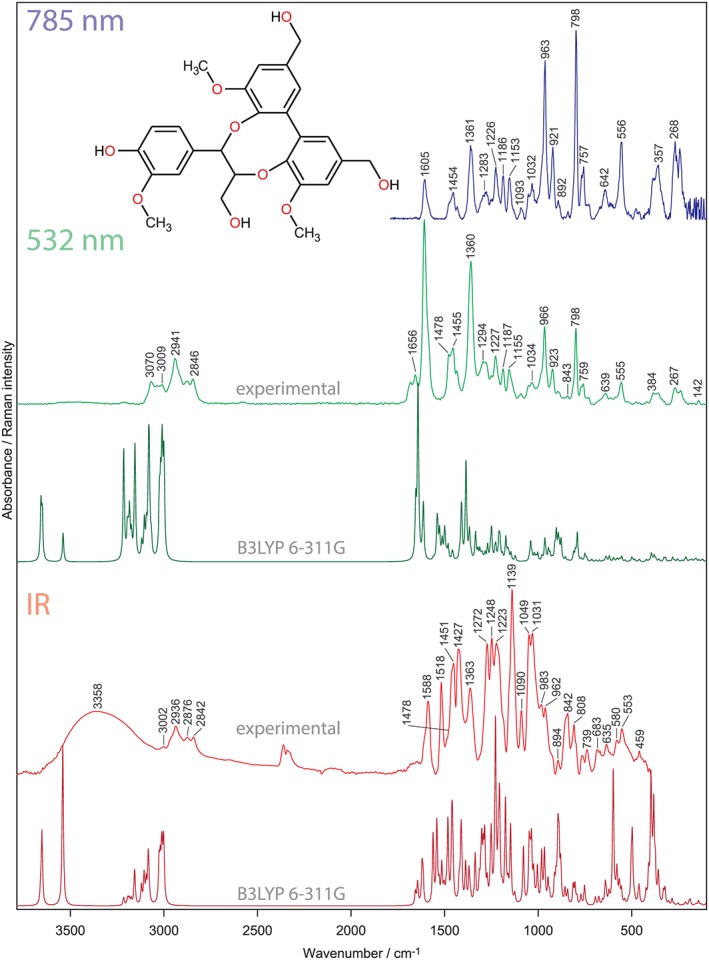
Figure 2.

Infrared and Raman spectra of DBDO. The shape of Raman spectra differs between the excitation wavelengths. This relates to resonance enhancement, which is only created at 532 nm. Calculated, unscaled spectra are also shown [Colour figure can be viewed at http://wileyonlinelibrary.com]
