
Figure 5.
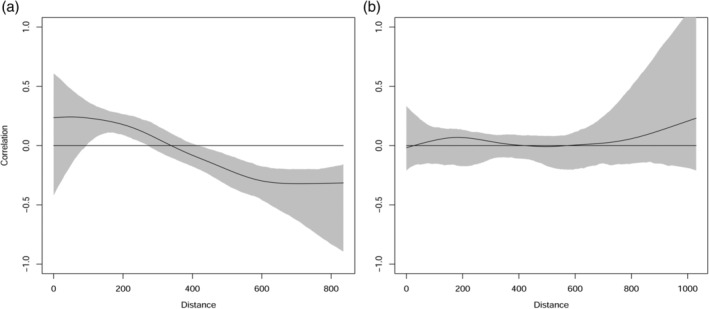
Multivariate spline correlograms with bootstrapped 95% confidence intervals of the annual catch of across Great Britain (a) Aphids. The y intercept indicates the local covariance function (0.23), the x, the spatial extent (0–800 km) and the x intercept is an estimate of the correlation length (338 km) (b) Moths. The y intercept indicates the local covariance function (0), the x, the spatial extent (0–800 km) and the x intercept is an estimate of the correlation length (0 km).