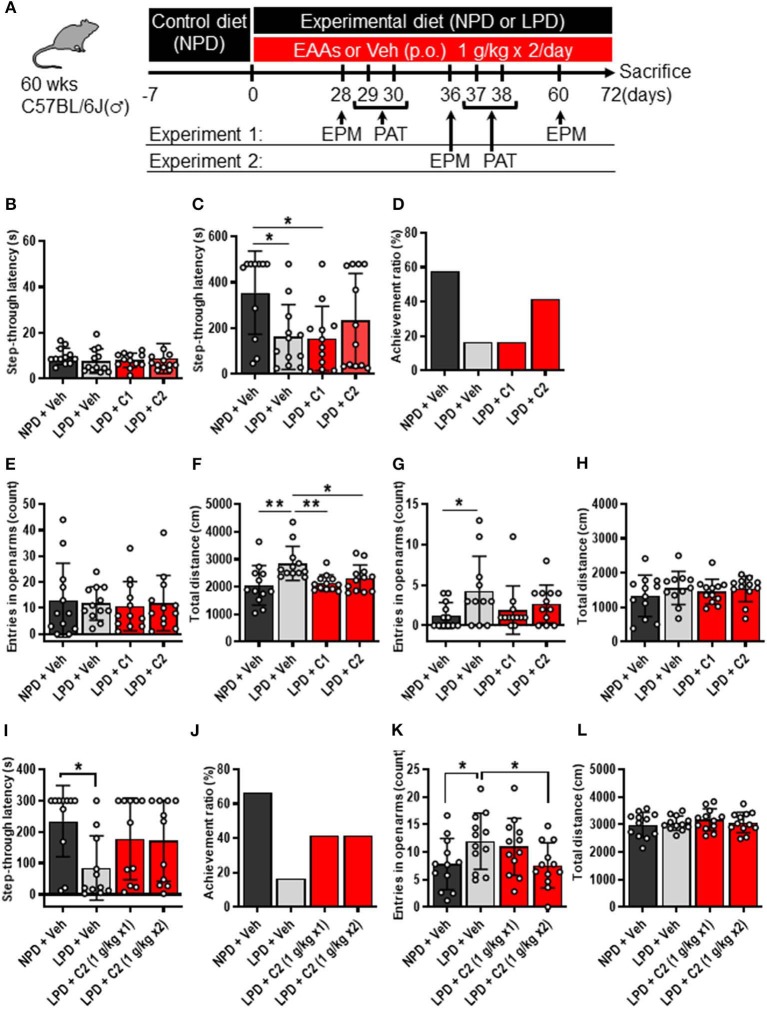
Figure 1.
LPD induced cognitive decline, agitation, and disinhibition behavior, but EAAs ameliorated these changes. (A) Schematic diagram of the experimental procedure. Experiment 1 data are shown in (B–H). (B–D) Summary of PAT results. (B) During the training session, there was no significant difference among the groups. (C) Mean step-through latency in each group during the training trial [F(3, 43) = 3.4, p < 0.05]. The latency time was significantly lower in the LPD + Veh group than in the NPD + Veh group (*p < 0.05) and in the LPD + C1 group than in the NPD + Veh (*p < 0.05) but not in the LPD + C2 group compared with that in the NPD + Veh group. (D) Summary of the achievement ratio which is the effect of the 1st electrical stimulation (ES) on step-through latency in each group. (E–H) Summary of EPM test results on day 28 (E,F) and day 60 (G,H). (E) Mean number of entries in the open arms on day 28 in each group. There was no significant difference among the groups. (F) Mean total distance traveled on day 28 in each group [F(3, 44) = 5.0, p < 0.01]. The total distance was significantly increased in the LPD + Veh group compared with that in the NPD + Veh group (**p < 0.01, Holm-Sidak's test), in the LPD + Veh group compared with that in the LPD + C1 group (**p < 0.01, Holm-Sidak's test), and in the LPD + Veh group compared with that in the LPD + C2 group (*p < 0.05, Holm-Sidak's test). (G) Mean number of entries in the open arms on day 60 in each group (p < 0.05, Bartlett's test). The number of entries in the open arms was significantly higher in the LPD + Veh group than in the NPD + Veh group (*p < 0.05, Dunnett's test). (H) Mean total distance traveled on day 60 in each group. There was no significant difference among the groups. Experiment 2 data are shown in (I–L). (I,J) Summary of PAT results. (I) Mean step-through latency in each group during the training trial [F(3, 40) = 2.9, p < 0.05]. The latency time was significantly decreased in the LPD + Veh group compared with that in the NPD + Veh group (*p < 0.05). (J) Summary of the achievement ratio in each group. (K,L) Summary of EPM test results. (K) Mean number of entries in the open arms in each group [F(3, 44) = 4.1, p < 0.05]. The number of entries in the open arms was significantly higher in the LPD + Veh group than in the NPD + Veh group (*p < 0.05) and in the LPD + C2 (1 g/kg x2) group than in the LPD + Veh group (*p < 0.05). (L) Mean total distance in each group. There was no significant difference among the groups. Error bars and dots indicate SD and scores of individual mice, respectively. NPD, normal protein diet; LPD, low protein diet; EPM, elevated plus maze; PAT, passive avoidance test; Veh, vehicle; p.o., per os; C1, composition 1; C2, composition 2.

