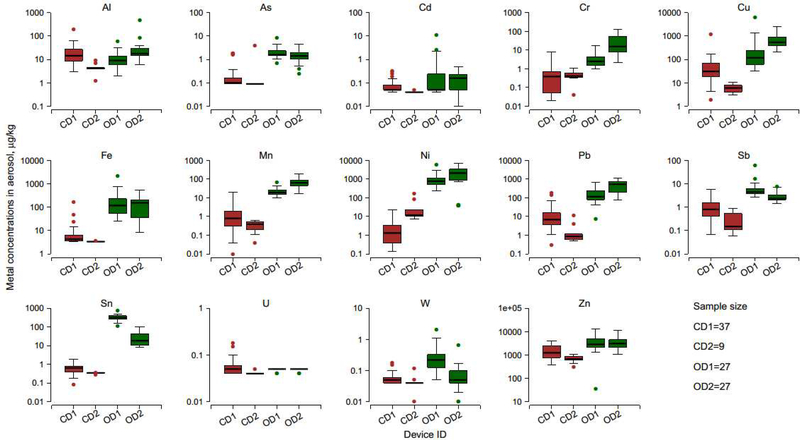
Figure 2.
Boxplots of metal concentrations in aerosols by device type. The horizontal lines within boxes indicate medians; boxes, interquartile ranges; whiskers, values within 1.5 times the interquartile range from boxes; solid circles outside the box, outlier data values. For open-system devices (OD1, OD2), only samples collected at the intermediate power setting were analyzed.

