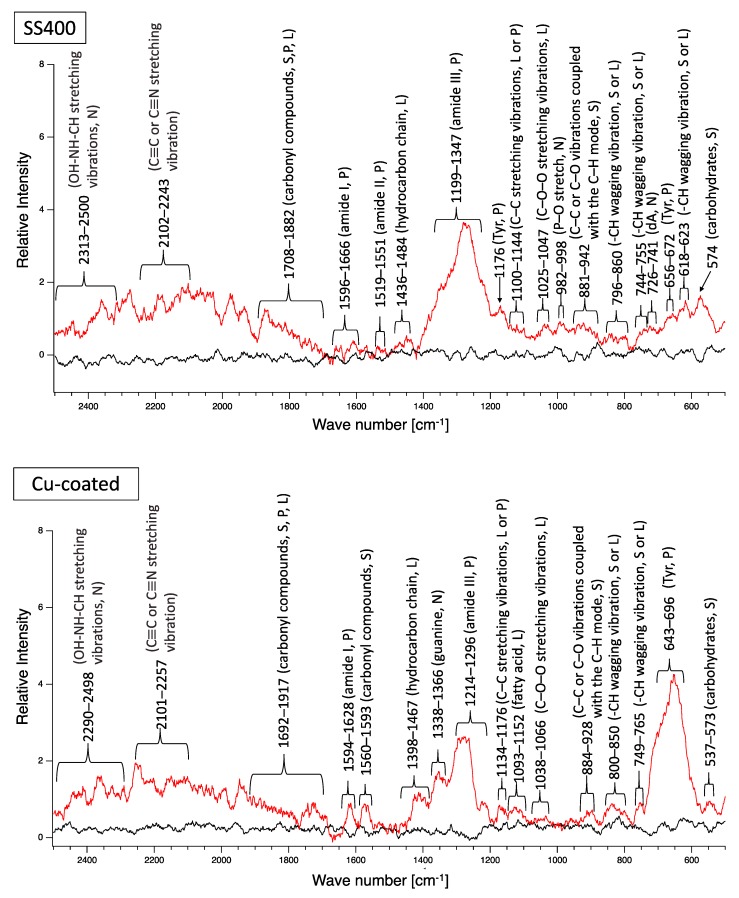
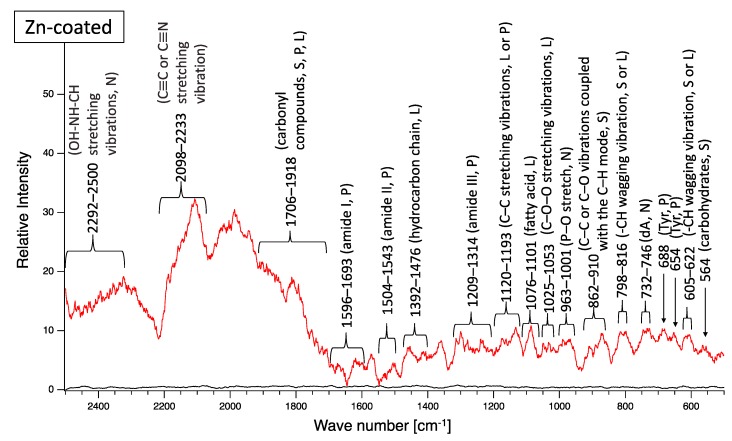
Figure 6.
Raman peaks of sediments on the surface of the coupons following outdoor exposure testing (red line). Black lines show the Raman peaks of the surface of the specimens before the test. Detected Raman peaks after the test were assigned to related chemical bonds of compounds according to information in references [27,28,29,30,31,32,33,34,35]. N: nucleic acids; L: lipids; P: proteins; S: polysaccharides.


