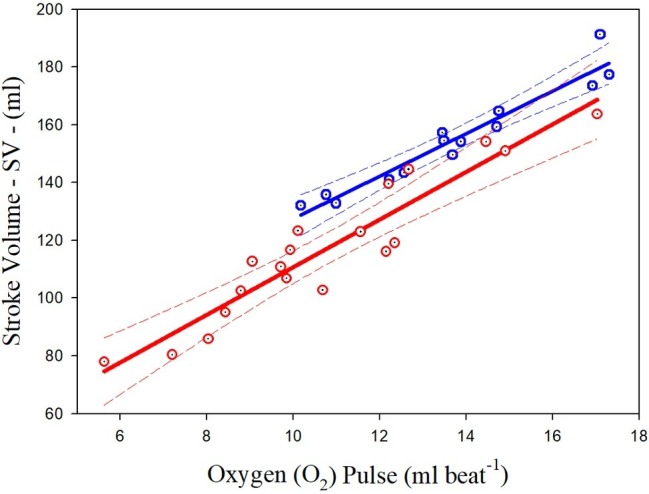
Figure 2.

Relationships between highest sub-maximal exercise stroke volume and oxygen pulse in Paralympic athletes with spinal cord injury (red scatterplot and curves) and Paralympic athletes with amputation and poliomyelitis (blue scatterplot and curves). The relative equations [Eqs. (3) and (4)] for each curve are reported in the text.
