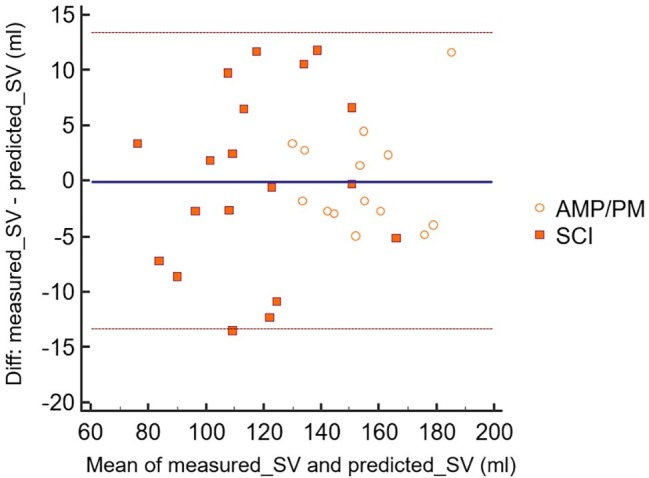
Figure 3.

Bland-Altman analysis of measured highest sub-maximal exercise stroke volume and predicted highest sub-maximal exercise stroke volume (sv) from oxygen pulse. The scatter points are related to both Paralympic athletes with spinal cord injury (SCI) [computed with Eq. (3)] and Paralympic athletes with amputation and poliomyelitis (AMP/PM) [computed with Eq. (4)]. Mmeans, mean values of measured highest sub-maximal exercise stroke volume and predicted highest sub-maximal exercise stroke volume; Diff, difference between measured highest sub-maximal exercise stroke volume and predicted highest sub-maximal exercise stroke volume. The dashed lines indicate the 95% confidence intervals for these data points.
