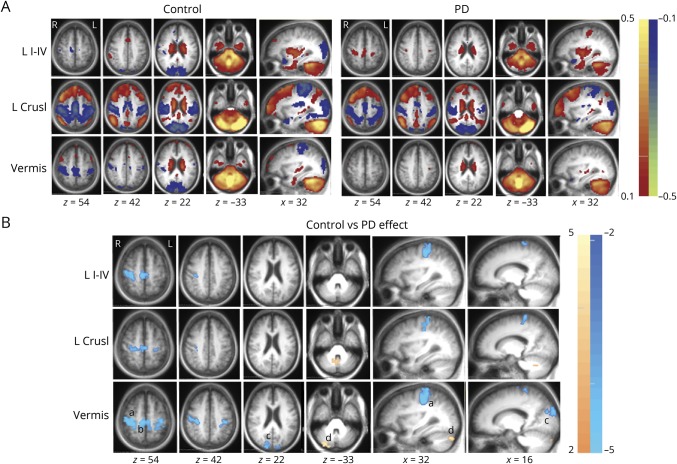
Figure 1. Cerebellar FC differences based on disease status.
(A) Cerebellar resting-state functional connectivity (FC) [z(r) maps] averaged over participants in the control (left) and Parkinson disease (PD) (right) groups. Each row corresponds to a distinct cerebellar lobular seed region of interest. Warm and cool colors represent positive and negative correlations. The underlying image is the study-specific atlas template. The Talairach atlas plane of section is indicated under each column; z and x correspond to the axial and sagittal sections, respectively. (B) Random-effects analysis contrasting the control and PD groups. Mapped quantity is the gaussianized t statistic (z score) thresholded at |z| > 3.5. All clusters are significant at the p ≤ 0.05 level. Warm colors indicate more positive correlations in the control group. Cool colors indicate more negative correlations in the control group. Significant clusters of altered vermal FC in PD reported here include the right peristriate occipital cortex (BA19, cluster size 142, Talairach coordinates x = 16, y = −88, and z = 24), right sensorimotor cortex (Brodmann area [BA] 4, 3, 1, 2, cluster size 493, Talairach coordinates x = 37, y = −27, and z = 51). a = sensorimotor cortex; b = supplementary motor area; c = peristriate visual association cortex (BA 19); d = right Crus I and Crus II; L CrusI = left Crus I lobule seed region; L I-IV = left lobules I through IV seed region.

