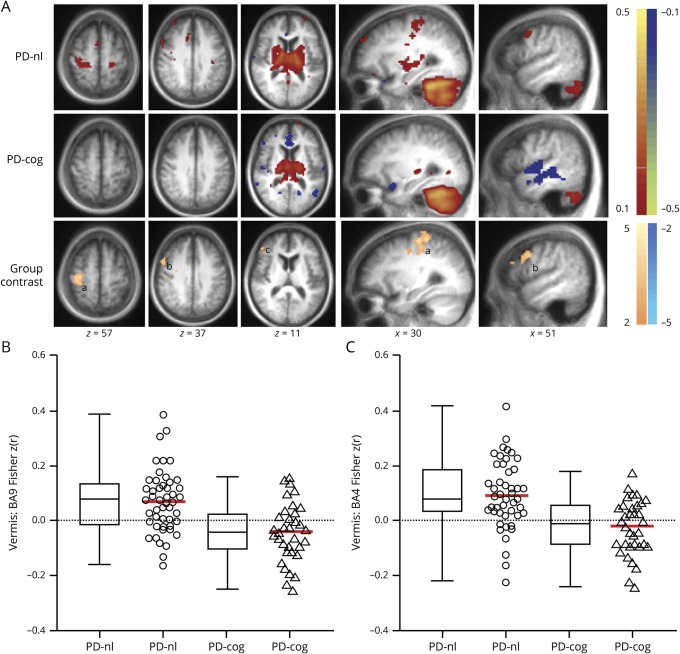
Figure 3. Cerebellar FC differences based on cognitive status.
(A) Cerebellar resting-state functional connectivity (FC) [z(r) maps] with vermis seed region averaged over participants in the Parkinson disease (PD) group without cognitive impairment (PD-nl, top row) and PD with impaired cognition (PD-cog, middle row). Warm and cool colors represent positive and negative correlations. Random-effects analysis contrasting PD-nl and PD-cog groups (bottom row). Mapped quantity is the gaussianized t statistic (z score) thresholded at |z| > 2.6. All clusters are significant at the p ≤ 0.05 level. Warm colors indicate more positive correlations in the PD-nl group. Significant clusters reported here include right dorsolateral prefrontal cortex (Brodmann area [BA] 9,46, cluster size 120, Talairach coordinates x = 49, y = 10, and z = 33) and right sensorimotor cortex (BA4, 3, 1, 2, cluster size 219, Talairach coordinates x = 35, y = −22, and z = 51). (B and C) Boxplots (with median value and interquartile range) and scatterplots with mean value (red) demonstrate the significantly weaker (less positive) (B) vermis:dorsolateral prefrontal cortex (BA9) FC and (C) vermis:sensorimotor cortex (BA4) FC in the PD-cog (triangles) group compared to the PD-nl (circles) cohort. a = sensorimotor cortex; b = right dorsolateral prefrontal cortex, BA9; c = right dorsolateral prefrontal cortex, BA46.

