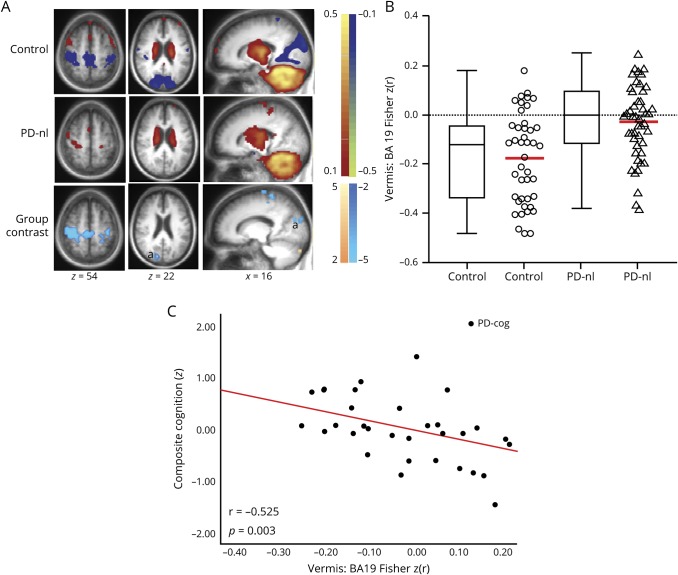
Figure 5. Vermal FC differences between participants with PD without cognitive impairment and controls.
(A) Resting-state functional connectivity (FC) [z(r) maps] with vermis seed region averaged over control participants (top row) and Parkinson disease (PD) group without cognitive impairment (PD-nl, middle row). Warm and cool colors represent positive and negative correlations. Random-effects analysis contrasting the controls and PD-nl group (bottom row). Mapped quantity is the gaussianized t statistic (z score) thresholded at |z| > 3.5. All clusters are significant at the p ≤ 0.05 level. Cool colors indicate more negative correlations in the control group. (B) Boxplots (with median value and interquartile range) and scatterplots with mean value (red) demonstrate the significantly weaker anticorrelations (closer to 0) of vermis:BA19 FC in the PD-nl group compared to controls and (C) correlation of vermis:BA19 significant cortical cluster FC with composite cognitive z score showing the much larger effect size (r = −0.525) in the subset of participants with PD with cognitive impairment (PD-cog). a = peristriate visual association cortex, BA19.

