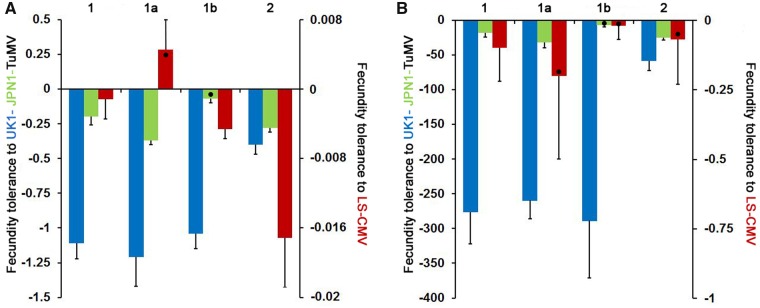
Figure 2.
Arabidopsis fecundity and mortality tolerance to UK1-TuMV, LS-CMV and JPN1-TuMV. Panel A: values of fecundity tolerance to UK1-TuMV (blue), to JPN1-TuMV (green) and to LS-CMV (red) measured as the slope of the SW to virus accumulation linear regression. Panel B: values of mortality tolerance to the same three viruses measured as the slope of the LP to virus accumulation linear regression. Steeper slopes (lower values) indicate lower tolerance. Data are presented for allometric Groups 1 and 2, and for Subgroups 1a and 1b, and are mean ± standard errors across plant genotypes. Black dots indicate values non-different from zero. Note the different scales for tolerance to TuMV and to CMV.

