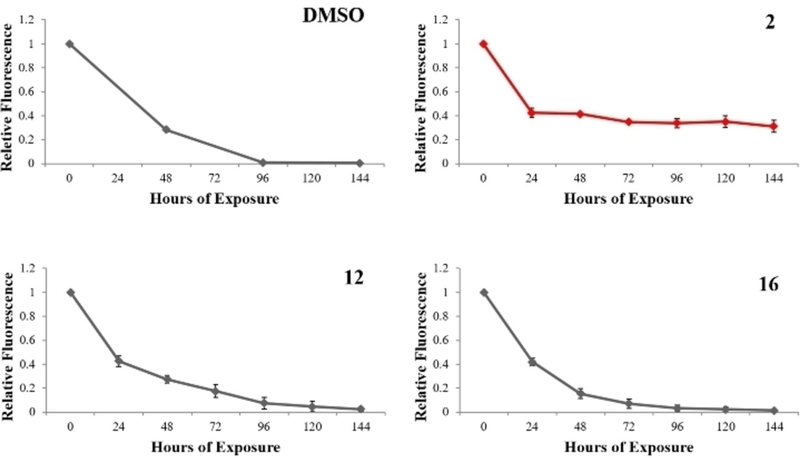
Figure 12.
Flow cytometry analysis of cellular proliferation in HEK 293 cells cultured with selected compounds or DMSO only (Control). Cells were exposed to a fluorescent trace dye that becomes diluted with each cell division. Cells cultured with compound 2 were induced into mitotic arrest (red). Error bars indicate one standard deviation.

