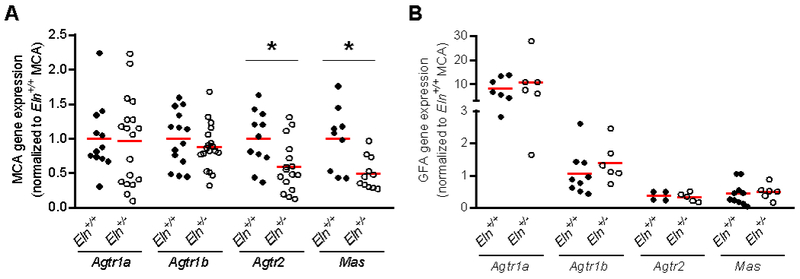
Figure 4.

Gene expression of angiotensin II receptors Agtr1a, Agtr1b, and Agtr2 and Ang(1-7) receptor Mas in (A) middle cerebral artery (MCA) and (B) gastrocnemius feed artery (GFA) from Eln+/+ and Eln+/− mice. All values are normalized to MCA expression of the particular gene in Eln+/+ mice. Group means indicated by red line. *p<0.05 vs. Eln+/+.
