
Figure 2. In vitro and in vivo CEST MRI of hydrogel formulations with varying gelatin content.
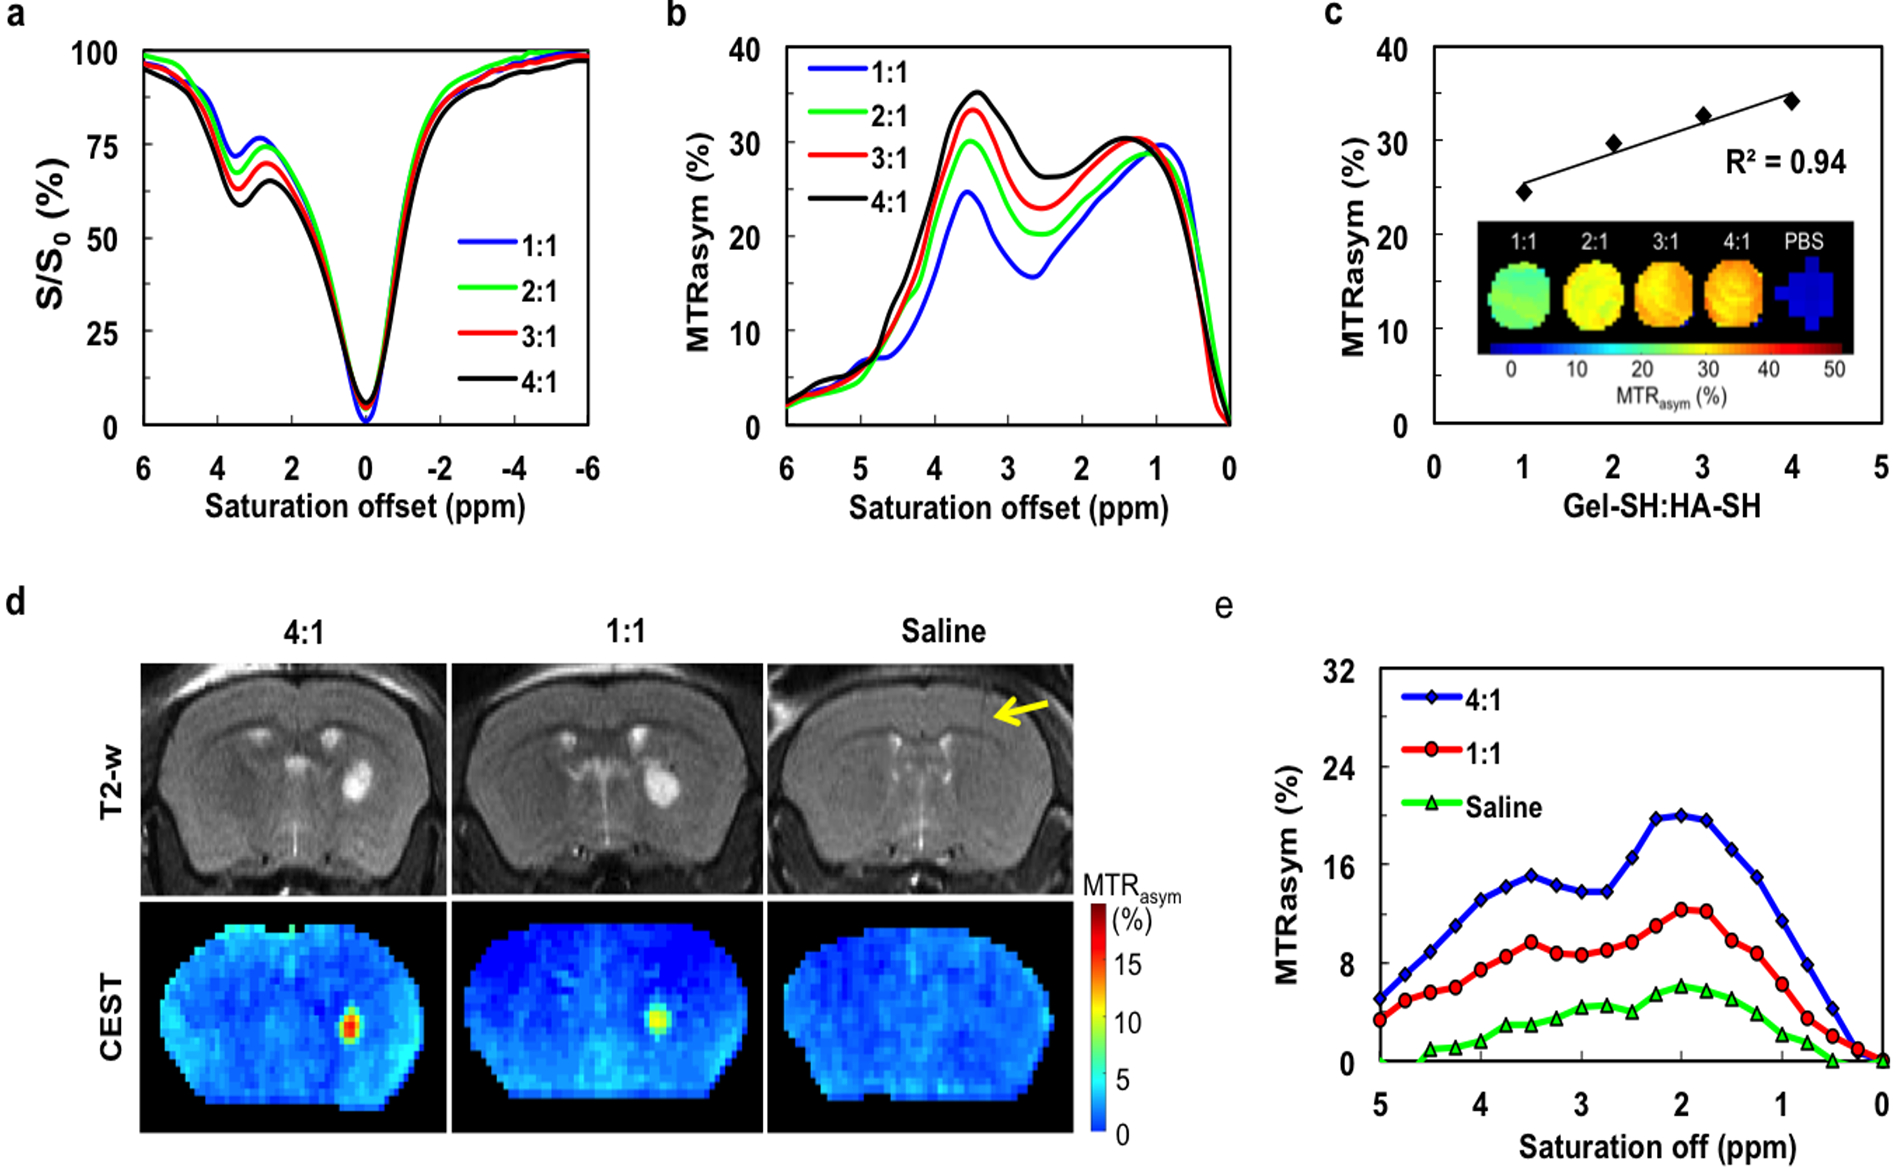
a) In vitro z-spectra and (b) In vitro MTRasym values of hydrogels with different Gel-SH to HA-SH ratios (4:1, 3:1, 2:1, and 1:1) for a saturation power of 3.6 μT. c) Quantitative MTRasym values and CEST maps for various hydrogels at 3.6 ppm. Increasing the proportion of Gel-HS leads to higher CEST contrast, with the MTRasym values exhibiting a linear correlation with gelatin content. d) In vivo CEST MRI at 3.6 ppm of hydrogels (4:1 and 1:1 Gel-SH:HA-SH ratio) and sham (saline) control injected into striatum of mouse brain (arrow indicates needle track). d) In vivo MTRasym values of implanted hydrogel scaffolds and sham control.