
Figure 7. In vivo CEST MRI and two-color NIR imaging of hydrogel degradation.
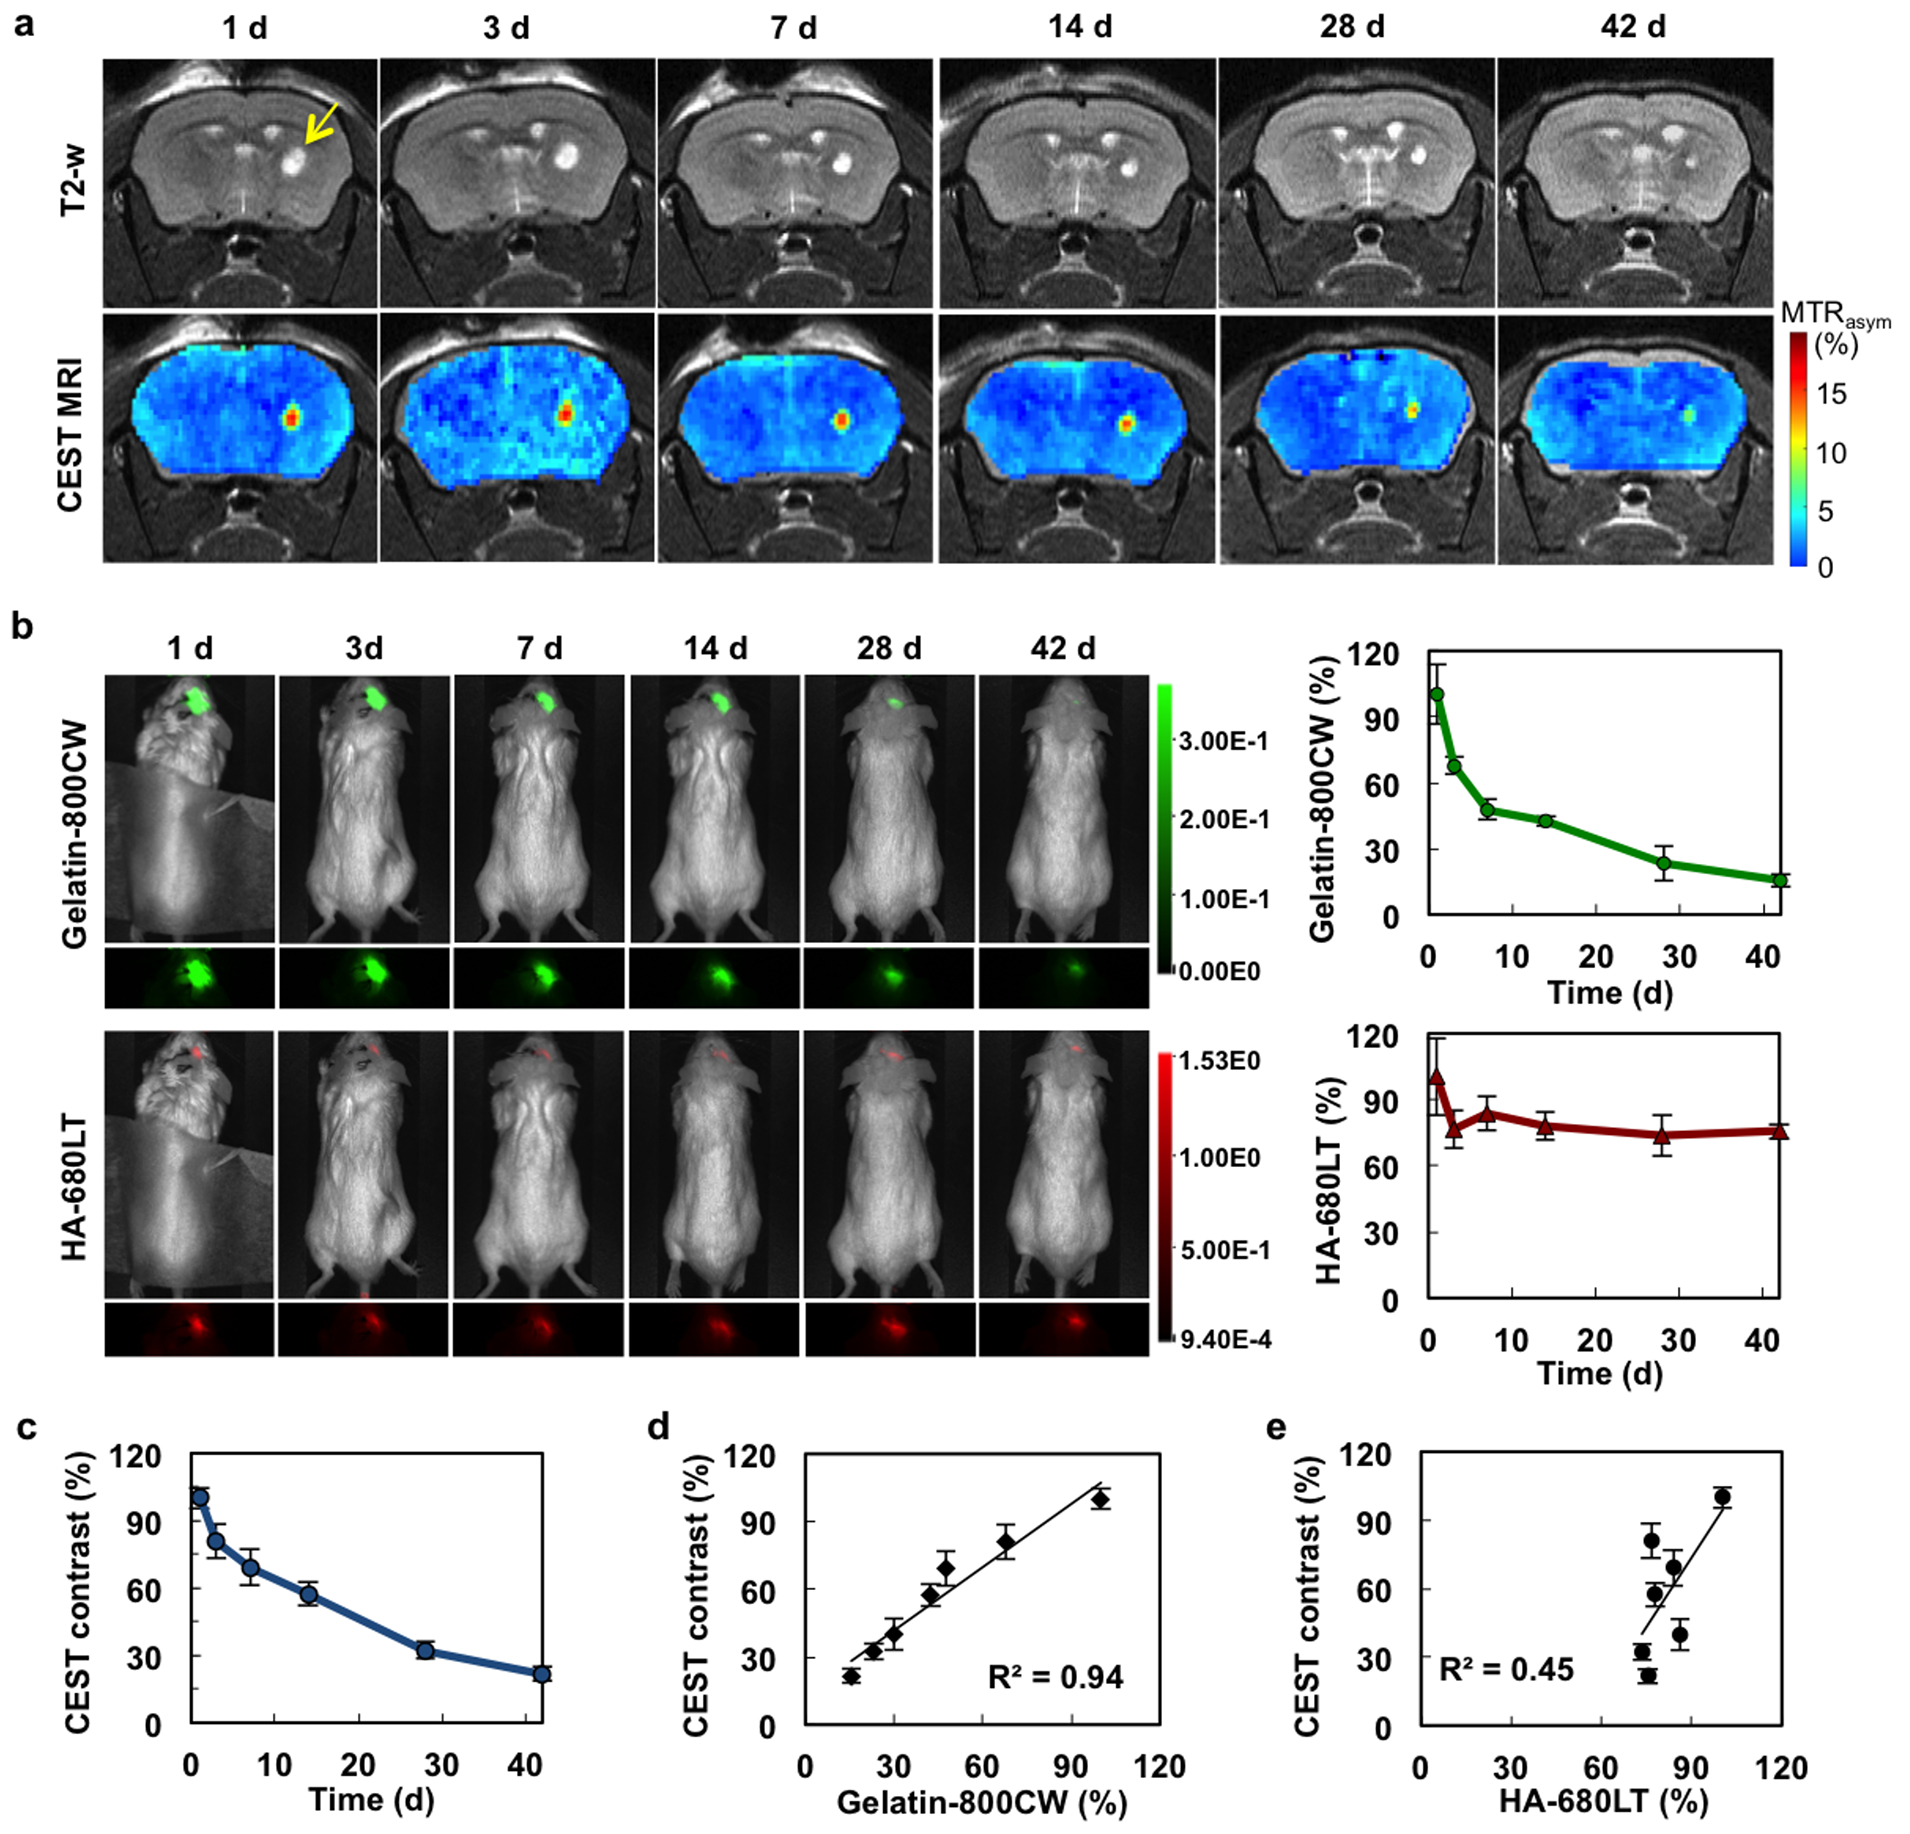
a) Time course of T2-weighted and CEST MRI (at 3.6 ppm) from day 1 to day 42. Arrow indicates the region of hydrogel injection in the striatum. b) NIR images and NIR signal quantification of the same mice shown in a) (gelatin=green; HA=red). c) Quantification of CEST MRI signal. d) and e) Correlation of the in vivo CEST MRI signal NIR signal for gelatin and HA, respectively. For quantification, all data were normalized to day 1 (n=4 animals).