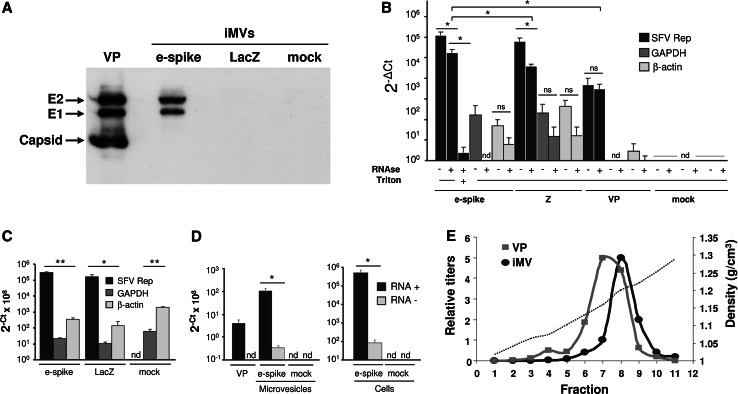
Fig. 5.
Characterization of iMVs. a Microvesicles purified from HuH-7 cells electroporated with the indicated RNAs were analysed by Western blot with a mixture of α-spike and anti-capsid sera. The gel was loaded with 105 IU of SFV-enh-spike iMVs (e-spike) or an equivalent volume of material purified from SFV-LacZ (LacZ) or mock-electroporated cells. A sample containing 5 × 10⁷ purified SFV-LacZ VPs was used as control (VP). b Samples containing 106 IU of purified SFV-enh-spike iMVs (e-spike), or equivalent volume of material purified from SFV-LacZ (Z) or mock-electroporated cells (mock), were analysed by quantitative RT-PCR, with or without previous RNAse treatment, using oligonucleotides specific for SFV Rep or GAPDH as described in “Materials and methods”. A sample containing 106 purified SFV-LacZ VPs was used as positive control (VP). When indicated, iMV samples were treated with 0.1 % Triton X-100 for 15 min at RT previous to RNAse treatment (Triton). Data is shown as 2−Δ(Ct mock−Ct iMV or VP) for each gene. c HuH-7 cells electroporated with SFV-enh-spike (e-spike), SFV-LacZ (LacZ) RNAs or mock-electroporated were analysed at 24 h post-electroporation by quantitative RT-PCR as described in b. d The relative amounts of positive- and negative-strand SFV RNA (RNA+ and RNA−, black and grey columns, respectively) present in iMVs (5 × 10⁵ IU) and cells electroporated with SFV-enh-spike RNA (at 24 h postelectroporation) was analysed by RT using oligonucleotides specific for each SFV RNA strand, followed by quantitative PCR as described in “Materials and methods”. 107 VPs of SFV-LacZ (VP) and material purified from mock-electroporated cells (mock) were used as positive and negative controls, respectively. In b–d data represent the mean + SD of at least three independent experiments analysed in triplicates. **p < 0.01, *p < 0.05. e The density of purified iMVs or VPs was determined by equilibrium centrifugation on a 5–60 % sucrose gradient from which 11 fractions were collected. The infectivity of each fraction was determined as described in “Materials and methods” and is represented as the relative titre (left Y-axis scale). The density of each fraction was calculated by measuring its refractive index (dashed line, right Y-axis scale). The iMV peak corresponds to 5 × 10⁷ IU/ml and the VP peak to 8 × 10⁷ VPs/ml. ns not significant, nd not detected

