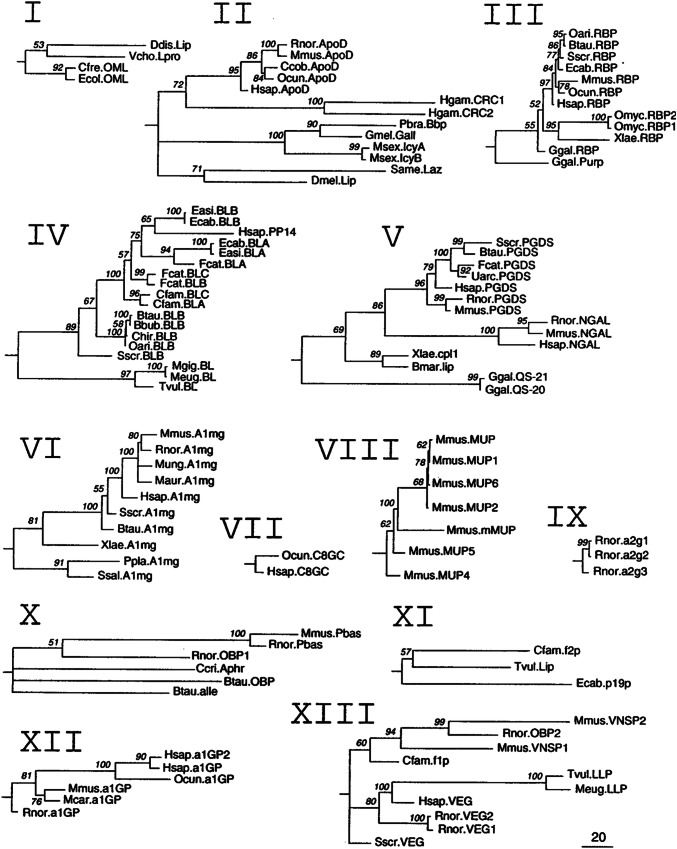
Fig. 1.
Phylogenetic trees derived from maximum-likelihood analyses of the individual clades of lipocalins. Local bootstrap probability (LBP) values are indicated in each node. Polytomies reflect nodes with LBP values below 50%. The scale bar represents branch length (number of amino acid substitutions/100 residues).
Reproduced with permission from Ganfornina et al. [5]

