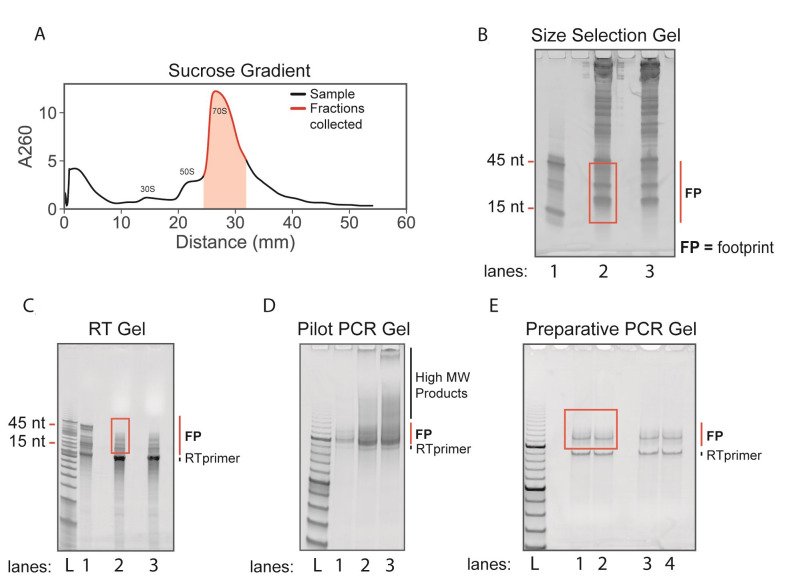
Figure 2. Ribosome profiling sucrose gradients and gels.
A. Sucrose gradient trace from Step G9. A volume of ~1,050 µl was collected (highlighted in red) containing 70S ribosomes. B. Size selection gel from Step I9. Lane 1: 15 nt and 45 nt size markers. Lanes 2 and 3: RNA from fractionated monosomes. The red box indicates the excised region containing ribosome footprints (FP). C. Reverse transcription gel from Step O9. Lane 1: ligated and reverse transcribed 15 nt and 45 nt size markers. Lanes 2 and 3: ligated and reverse transcribed ribosome footprints. The red box indicates excised region which avoids the excess RT primer band. D. Pilot PCR gel from Step S7. Lanes 1-3: PCR amplified products after 5, 7, and 9 PCR cycles. Note the appearance of unwanted high molecular weight products after 7 and 9 PCR cycles. E. Preparative PCR gel from Step U8. The red box indicates excised region which avoids the RT primer band. FP = ribosome footprints. L = O’RangeRuler 10 bp ladder.

