
Fig. 2.
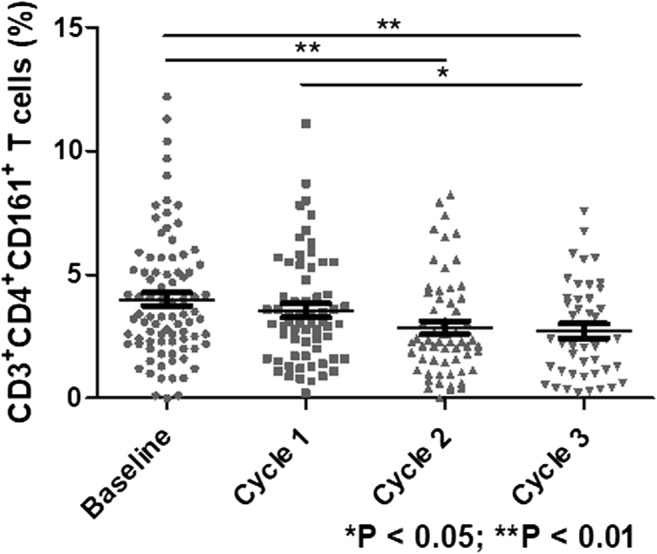
Serial changes in CD3+CD4+CD161+ T cells according to Len-dex therapy. The frequency of CD3+CD4+CD161+ T cells at the time of Len-dex initiation (baseline, n = 90) and after completion of 1st, 2nd, and 3th cycles of administration (n = 64, 59, and 45, respectively) was analyzed. At baseline, the CD3+CD4+CD161+ T cell frequency was 4.00 ± 0.28%, which significantly decreased to 2.86 ± 0.26% (P = 0.005) and 2.72 ± 0.29% (P = 0.004) after the 2nd and 3rd cycles of therapy, respectively. Data are presented as mean ± SEM and t tests were used to compare the continuous variables