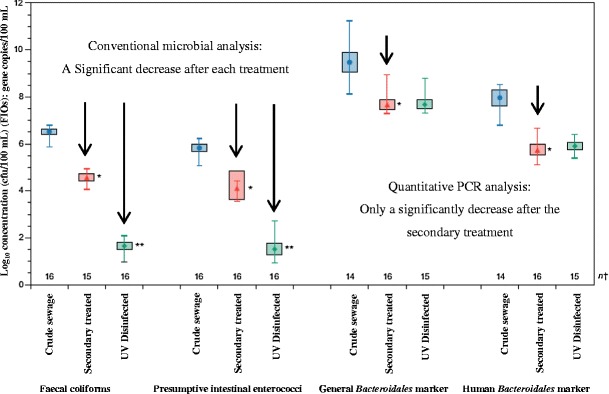
Fig. 4.

Mean, range and 95 % confidence intervals of the mean for faecal indicator organisms (FIOs) (expressed as log10 CFU/100 mL) and Bacteroidales marker concentrations (gene copies/100 mL) in crude sewage (blue circle), secondary treated sewage (red triangle) and UV-disinfected sewage (green dot). The secondary treatment sewage that was significantly different from the mean of the crude extract (*) and UV-disinfected sewage that was significantly different from the secondary treated sewage (**) are also indicated in the figure (adapted from [168])
