
Fig. 2.
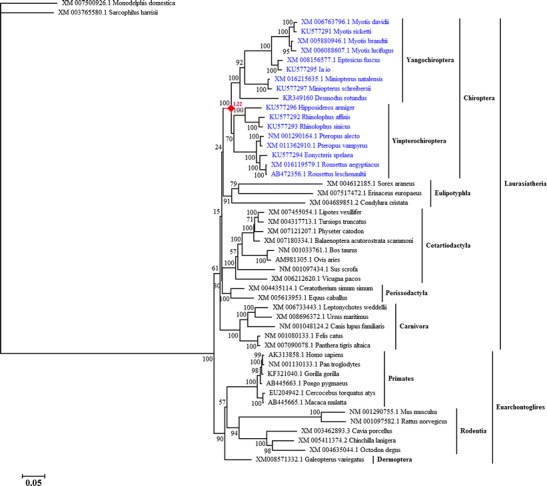
ML tree of TLR7 conducted from complete coding sequences. The bootstrap values are shown above or below the nodes. The branches with ω > 1 are labeled in red rhombus. The ω values are shown in red near the positively selected branches (conducted from model M2″)