Fig. 4.

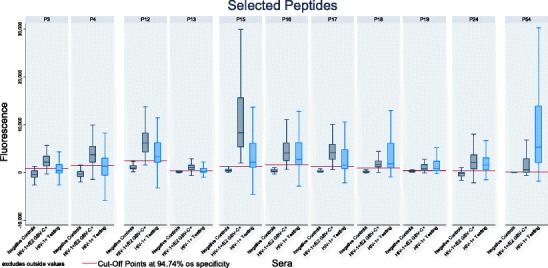
Distribution of fluorescence values for the testing panel together with HIV-1+/E2 GBV-C+ group (as positive control) and negative controls serum samples by peptide. Horizontal red line indicates the ROC cut-off value of each peptide

Distribution of fluorescence values for the testing panel together with HIV-1+/E2 GBV-C+ group (as positive control) and negative controls serum samples by peptide. Horizontal red line indicates the ROC cut-off value of each peptide