
Fig. 1.
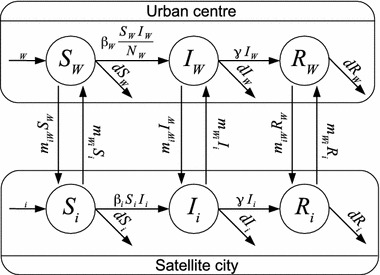
Flow diagram of the system. Represented here are the urban centre and one satellite city
Official websites use .gov
A
.gov website belongs to an official
government organization in the United States.
Secure .gov websites use HTTPS
A lock (
) or https:// means you've safely
connected to the .gov website. Share sensitive
information only on official, secure websites.
Flow diagram of the system. Represented here are the urban centre and one satellite city