
Fig. 2.
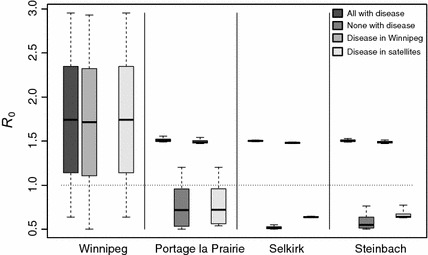
Sensitivity of the general to variations of between 0.5 and 3, where is the city indicated on the axis. The box shows the extent of results between the 25th and 75th percentile, while the whiskers extend to the most extreme values. The bar in the box is the median. The sensitivity to changes in when the disease is in Winnipeg is irrelevant and is not represented