
Fig. 3.
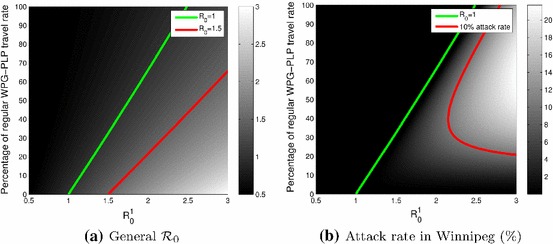
Plots as functions of in Portage la Prairie and the reduction of movement between Winnipeg and Portage la Prairie. a General ; the green and red curves show the locations of and , respectively. b Attack rate in Winnipeg; the green and red curves show the locations of and a 10 % attack rate, respectively