
Fig. 4.
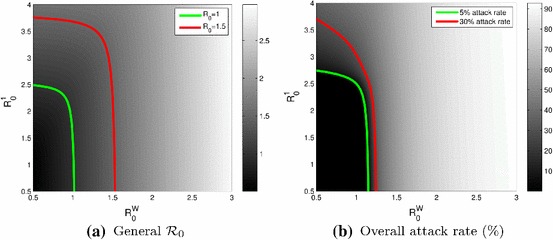
Plots as functions of (Winnipeg) and (Portage la Prairie). a Value of the general ; the green and red curves show the location of and , respectively. b Overall attack rate; the green and red curves are 5 and 30 %, respectively
Official websites use .gov
A
.gov website belongs to an official
government organization in the United States.
Secure .gov websites use HTTPS
A lock (
) or https:// means you've safely
connected to the .gov website. Share sensitive
information only on official, secure websites.
Plots as functions of (Winnipeg) and (Portage la Prairie). a Value of the general ; the green and red curves show the location of and , respectively. b Overall attack rate; the green and red curves are 5 and 30 %, respectively