
Fig. 6.
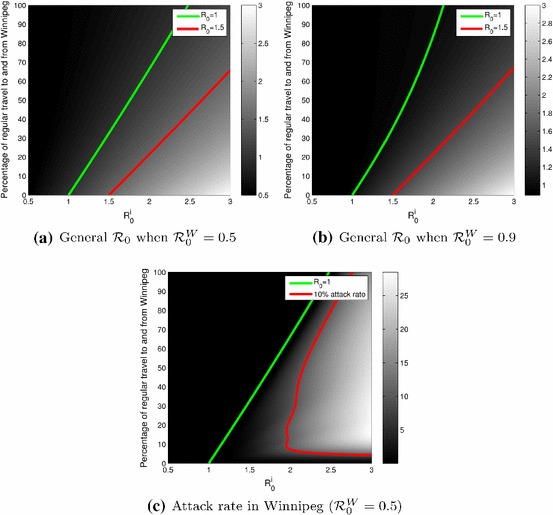
Plots as functions of taken equal and the percentage of the regular movement rates between Winnipeg and the satellite cities. a Case where . b Case where . c Attack rate in Winnipeg, in %, when
Official websites use .gov
A
.gov website belongs to an official
government organization in the United States.
Secure .gov websites use HTTPS
A lock (
) or https:// means you've safely
connected to the .gov website. Share sensitive
information only on official, secure websites.
Plots as functions of taken equal and the percentage of the regular movement rates between Winnipeg and the satellite cities. a Case where . b Case where . c Attack rate in Winnipeg, in %, when