Fig. 6.

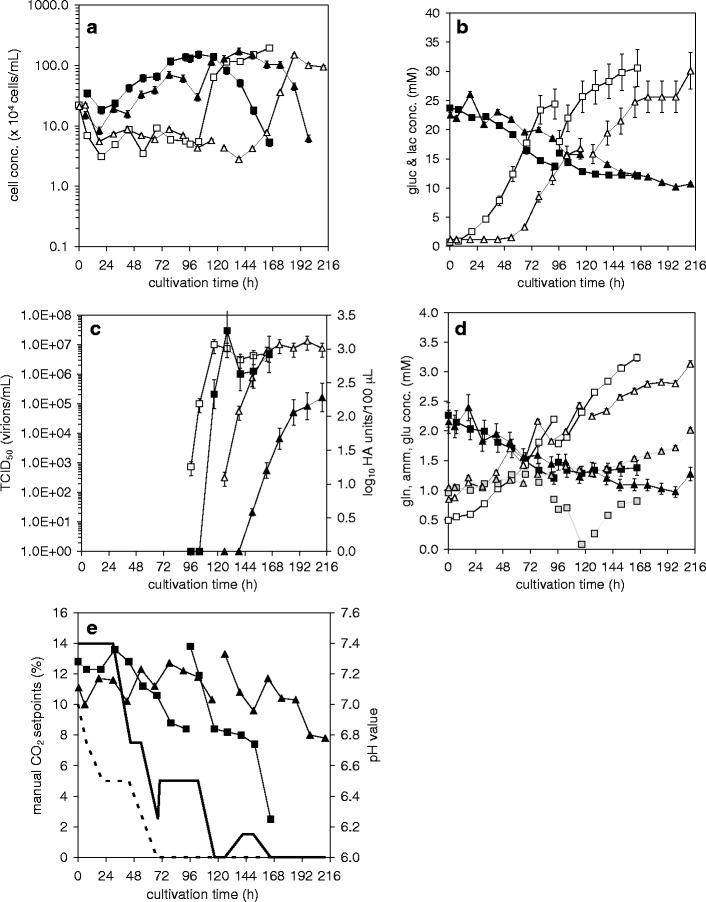
Release and uptake of metabolites, cell concentrations, and virus titers during growth of MDCK and Vero cells on Cytodex 1 microcarriers (2 g/L) in SF medium in a 2 L wave bioreactor (0–96 h and 0–126 h respectively) and subsequent direct influenza A/PR/8/34 (H1N1) (RKI) virus production (cell line adapted viruses) (96–168 h and 126–212 h) (for details see Table 1): MDCK cells (squares) compared to Vero cells (triangles). a cell concentrations: cells on MC (full symbols), cells in suspension (empty symbols); b glucose (full symbols), lactate (empty symbols); c virus titer in log HA units/100 μL (full symbols) and infectious virus titer (TCID50) (empty symbols); d glutamine (full symbols), ammonia (empty symbols), glutamate (grey symbols); e pH value (full symbols) and manual CO2 setpoints (line, Vero; dotted line, MDCK). Relative standard deviations were as given previously ((Lohr et al. 2009)); read-out for the more sensitive HA assay: log10 HA units/100 μL with a relative standard deviation of 9.3%
